Immigrants from Fiji vs Trinidadian and Tobagonian College, 1 year or more
COMPARE
Immigrants from Fiji
Trinidadian and Tobagonian
College, 1 year or more
College, 1 year or more Comparison
Immigrants from Fiji
Trinidadians and Tobagonians
56.9%
COLLEGE, 1 YEAR OR MORE
4.0/ 100
METRIC RATING
228th/ 347
METRIC RANK
55.8%
COLLEGE, 1 YEAR OR MORE
1.1/ 100
METRIC RATING
240th/ 347
METRIC RANK
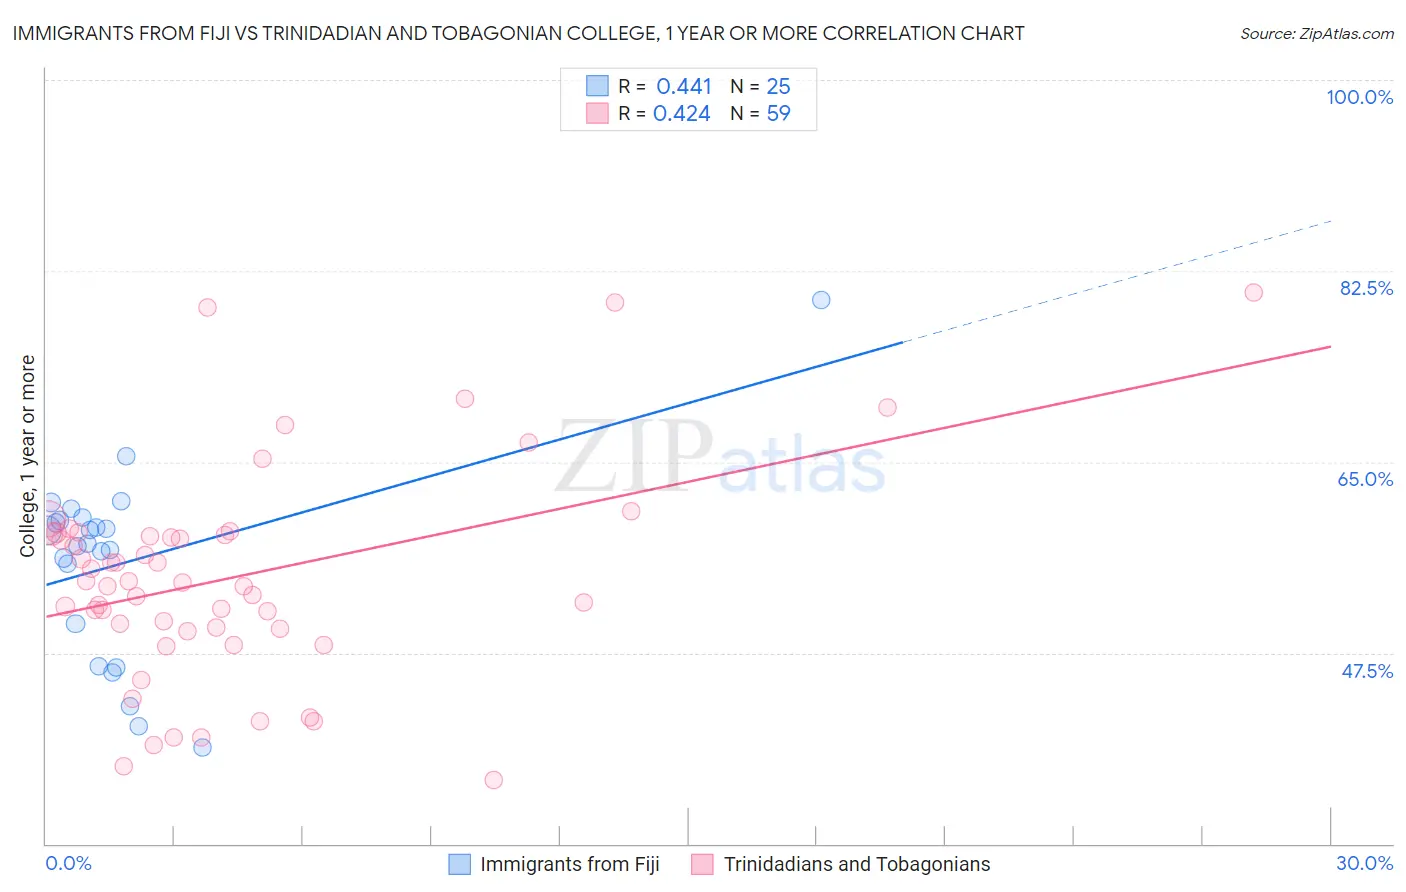
Immigrants from Fiji vs Trinidadian and Tobagonian College, 1 year or more Correlation Chart
The statistical analysis conducted on geographies consisting of 93,755,737 people shows a moderate positive correlation between the proportion of Immigrants from Fiji and percentage of population with at least college, 1 year or more education in the United States with a correlation coefficient (R) of 0.441 and weighted average of 56.9%. Similarly, the statistical analysis conducted on geographies consisting of 219,882,137 people shows a moderate positive correlation between the proportion of Trinidadians and Tobagonians and percentage of population with at least college, 1 year or more education in the United States with a correlation coefficient (R) of 0.424 and weighted average of 55.8%, a difference of 1.9%.
College, 1 year or more Correlation Summary
| Measurement | Immigrants from Fiji | Trinidadian and Tobagonian |
| Minimum | 38.9% | 35.8% |
| Maximum | 79.8% | 80.5% |
| Range | 40.9% | 44.7% |
| Mean | 55.8% | 54.4% |
| Median | 57.5% | 54.0% |
| Interquartile 25% (IQ1) | 48.2% | 49.7% |
| Interquartile 75% (IQ3) | 59.8% | 58.4% |
| Interquartile Range (IQR) | 11.5% | 8.7% |
| Standard Deviation (Sample) | 8.8% | 9.7% |
| Standard Deviation (Population) | 8.6% | 9.6% |
Demographics Similar to Immigrants from Fiji and Trinidadians and Tobagonians by College, 1 year or more
In terms of college, 1 year or more, the demographic groups most similar to Immigrants from Fiji are Cree (56.8%, a difference of 0.13%), Immigrants (57.0%, a difference of 0.15%), Immigrants from Western Africa (57.0%, a difference of 0.21%), Vietnamese (57.0%, a difference of 0.24%), and Liberian (56.7%, a difference of 0.35%). Similarly, the demographic groups most similar to Trinidadians and Tobagonians are French American Indian (55.8%, a difference of 0.050%), Puget Sound Salish (55.9%, a difference of 0.090%), Marshallese (55.8%, a difference of 0.15%), Osage (55.8%, a difference of 0.16%), and Chippewa (55.7%, a difference of 0.28%).
| Demographics | Rating | Rank | College, 1 year or more |
| Hmong | 5.4 /100 | #224 | Tragic 57.2% |
| Vietnamese | 4.7 /100 | #225 | Tragic 57.0% |
| Immigrants | Western Africa | 4.6 /100 | #226 | Tragic 57.0% |
| Immigrants | Immigrants | 4.4 /100 | #227 | Tragic 57.0% |
| Immigrants | Fiji | 4.0 /100 | #228 | Tragic 56.9% |
| Cree | 3.6 /100 | #229 | Tragic 56.8% |
| Liberians | 3.1 /100 | #230 | Tragic 56.7% |
| Immigrants | Burma/Myanmar | 2.7 /100 | #231 | Tragic 56.6% |
| Immigrants | Bangladesh | 2.6 /100 | #232 | Tragic 56.6% |
| Immigrants | Nonimmigrants | 2.5 /100 | #233 | Tragic 56.5% |
| Spanish Americans | 1.8 /100 | #234 | Tragic 56.3% |
| West Indians | 1.8 /100 | #235 | Tragic 56.3% |
| Iroquois | 1.7 /100 | #236 | Tragic 56.2% |
| Samoans | 1.6 /100 | #237 | Tragic 56.2% |
| Barbadians | 1.3 /100 | #238 | Tragic 56.0% |
| Puget Sound Salish | 1.1 /100 | #239 | Tragic 55.9% |
| Trinidadians and Tobagonians | 1.1 /100 | #240 | Tragic 55.8% |
| French American Indians | 1.0 /100 | #241 | Tragic 55.8% |
| Marshallese | 1.0 /100 | #242 | Tragic 55.8% |
| Osage | 1.0 /100 | #243 | Tragic 55.8% |
| Chippewa | 0.9 /100 | #244 | Tragic 55.7% |