Croatian vs Latvian College, 1 year or more
COMPARE
Croatian
Latvian
College, 1 year or more
College, 1 year or more Comparison
Croatians
Latvians
62.2%
COLLEGE, 1 YEAR OR MORE
97.1/ 100
METRIC RATING
99th/ 347
METRIC RANK
66.1%
COLLEGE, 1 YEAR OR MORE
100.0/ 100
METRIC RATING
26th/ 347
METRIC RANK
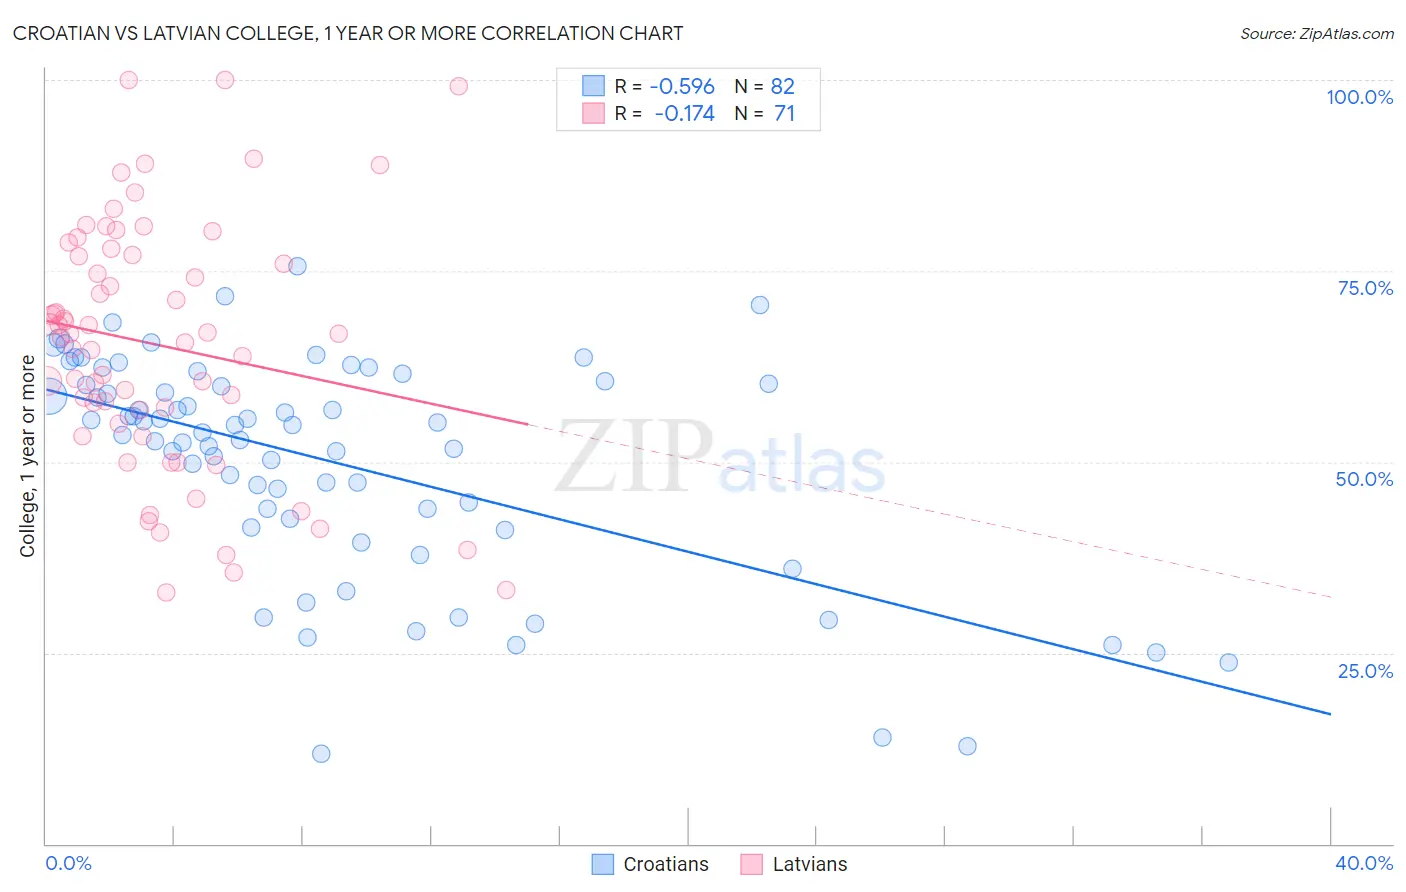
Croatian vs Latvian College, 1 year or more Correlation Chart
The statistical analysis conducted on geographies consisting of 375,729,085 people shows a substantial negative correlation between the proportion of Croatians and percentage of population with at least college, 1 year or more education in the United States with a correlation coefficient (R) of -0.596 and weighted average of 62.2%. Similarly, the statistical analysis conducted on geographies consisting of 220,726,880 people shows a poor negative correlation between the proportion of Latvians and percentage of population with at least college, 1 year or more education in the United States with a correlation coefficient (R) of -0.174 and weighted average of 66.1%, a difference of 6.2%.
College, 1 year or more Correlation Summary
| Measurement | Croatian | Latvian |
| Minimum | 11.7% | 32.9% |
| Maximum | 75.6% | 100.0% |
| Range | 63.8% | 67.1% |
| Mean | 50.1% | 65.3% |
| Median | 54.4% | 66.8% |
| Interquartile 25% (IQ1) | 42.5% | 54.9% |
| Interquartile 75% (IQ3) | 60.2% | 77.1% |
| Interquartile Range (IQR) | 17.6% | 22.1% |
| Standard Deviation (Sample) | 14.4% | 16.2% |
| Standard Deviation (Population) | 14.3% | 16.1% |
Similar Demographics by College, 1 year or more
Demographics Similar to Croatians by College, 1 year or more
In terms of college, 1 year or more, the demographic groups most similar to Croatians are Carpatho Rusyn (62.2%, a difference of 0.0%), Chinese (62.2%, a difference of 0.010%), Jordanian (62.2%, a difference of 0.010%), British (62.3%, a difference of 0.13%), and Icelander (62.1%, a difference of 0.16%).
| Demographics | Rating | Rank | College, 1 year or more |
| Immigrants | Egypt | 97.8 /100 | #92 | Exceptional 62.4% |
| Romanians | 97.7 /100 | #93 | Exceptional 62.4% |
| Immigrants | Croatia | 97.6 /100 | #94 | Exceptional 62.3% |
| British | 97.4 /100 | #95 | Exceptional 62.3% |
| Chinese | 97.2 /100 | #96 | Exceptional 62.2% |
| Jordanians | 97.2 /100 | #97 | Exceptional 62.2% |
| Carpatho Rusyns | 97.2 /100 | #98 | Exceptional 62.2% |
| Croatians | 97.1 /100 | #99 | Exceptional 62.2% |
| Icelanders | 96.8 /100 | #100 | Exceptional 62.1% |
| Swedes | 96.8 /100 | #101 | Exceptional 62.1% |
| Luxembourgers | 96.7 /100 | #102 | Exceptional 62.1% |
| Afghans | 96.4 /100 | #103 | Exceptional 62.0% |
| Chileans | 96.4 /100 | #104 | Exceptional 62.0% |
| Immigrants | Nepal | 96.3 /100 | #105 | Exceptional 62.0% |
| Palestinians | 96.3 /100 | #106 | Exceptional 62.0% |
Demographics Similar to Latvians by College, 1 year or more
In terms of college, 1 year or more, the demographic groups most similar to Latvians are Indian (Asian) (66.1%, a difference of 0.040%), Immigrants from Ireland (65.9%, a difference of 0.20%), Immigrants from France (65.8%, a difference of 0.37%), Immigrants from Belgium (66.3%, a difference of 0.39%), and Immigrants from China (66.4%, a difference of 0.47%).
| Demographics | Rating | Rank | College, 1 year or more |
| Immigrants | Switzerland | 100.0 /100 | #19 | Exceptional 66.5% |
| Immigrants | Korea | 100.0 /100 | #20 | Exceptional 66.5% |
| Immigrants | Hong Kong | 100.0 /100 | #21 | Exceptional 66.4% |
| Soviet Union | 100.0 /100 | #22 | Exceptional 66.4% |
| Immigrants | China | 100.0 /100 | #23 | Exceptional 66.4% |
| Immigrants | Belgium | 100.0 /100 | #24 | Exceptional 66.3% |
| Indians (Asian) | 100.0 /100 | #25 | Exceptional 66.1% |
| Latvians | 100.0 /100 | #26 | Exceptional 66.1% |
| Immigrants | Ireland | 100.0 /100 | #27 | Exceptional 65.9% |
| Immigrants | France | 100.0 /100 | #28 | Exceptional 65.8% |
| Immigrants | Northern Europe | 100.0 /100 | #29 | Exceptional 65.6% |
| Immigrants | Denmark | 100.0 /100 | #30 | Exceptional 65.6% |
| Turks | 100.0 /100 | #31 | Exceptional 65.5% |
| Bulgarians | 100.0 /100 | #32 | Exceptional 65.5% |
| Immigrants | Sri Lanka | 99.9 /100 | #33 | Exceptional 65.4% |