Central American Indian vs Trinidadian and Tobagonian College, 1 year or more
COMPARE
Central American Indian
Trinidadian and Tobagonian
College, 1 year or more
College, 1 year or more Comparison
Central American Indians
Trinidadians and Tobagonians
53.5%
COLLEGE, 1 YEAR OR MORE
0.1/ 100
METRIC RATING
286th/ 347
METRIC RANK
55.8%
COLLEGE, 1 YEAR OR MORE
1.1/ 100
METRIC RATING
240th/ 347
METRIC RANK
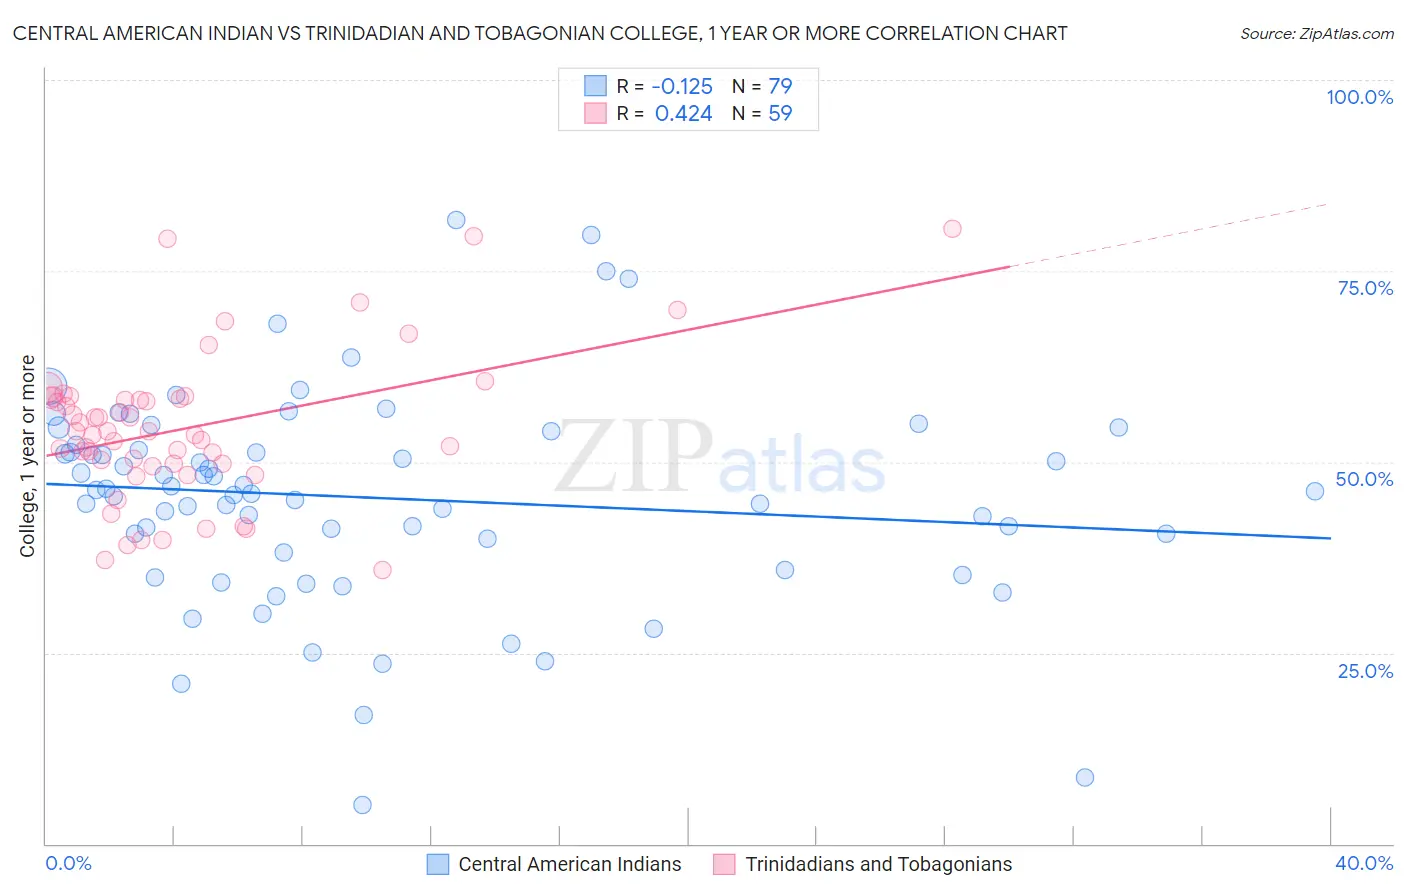
Central American Indian vs Trinidadian and Tobagonian College, 1 year or more Correlation Chart
The statistical analysis conducted on geographies consisting of 326,142,624 people shows a poor negative correlation between the proportion of Central American Indians and percentage of population with at least college, 1 year or more education in the United States with a correlation coefficient (R) of -0.125 and weighted average of 53.5%. Similarly, the statistical analysis conducted on geographies consisting of 219,882,137 people shows a moderate positive correlation between the proportion of Trinidadians and Tobagonians and percentage of population with at least college, 1 year or more education in the United States with a correlation coefficient (R) of 0.424 and weighted average of 55.8%, a difference of 4.3%.
College, 1 year or more Correlation Summary
| Measurement | Central American Indian | Trinidadian and Tobagonian |
| Minimum | 5.1% | 35.8% |
| Maximum | 81.6% | 80.5% |
| Range | 76.5% | 44.7% |
| Mean | 45.3% | 54.4% |
| Median | 46.2% | 54.0% |
| Interquartile 25% (IQ1) | 38.2% | 49.7% |
| Interquartile 75% (IQ3) | 52.2% | 58.4% |
| Interquartile Range (IQR) | 14.0% | 8.7% |
| Standard Deviation (Sample) | 13.9% | 9.7% |
| Standard Deviation (Population) | 13.9% | 9.6% |
Similar Demographics by College, 1 year or more
Demographics Similar to Central American Indians by College, 1 year or more
In terms of college, 1 year or more, the demographic groups most similar to Central American Indians are Immigrants from Belize (53.5%, a difference of 0.030%), Immigrants from Guyana (53.5%, a difference of 0.040%), Alaska Native (53.4%, a difference of 0.20%), Immigrants from Ecuador (53.4%, a difference of 0.21%), and Alaskan Athabascan (53.4%, a difference of 0.22%).
| Demographics | Rating | Rank | College, 1 year or more |
| Arapaho | 0.1 /100 | #279 | Tragic 54.1% |
| Cheyenne | 0.1 /100 | #280 | Tragic 54.1% |
| Colville | 0.1 /100 | #281 | Tragic 54.1% |
| Guyanese | 0.1 /100 | #282 | Tragic 54.1% |
| Nicaraguans | 0.1 /100 | #283 | Tragic 53.9% |
| Ute | 0.1 /100 | #284 | Tragic 53.8% |
| Immigrants | Guyana | 0.1 /100 | #285 | Tragic 53.5% |
| Central American Indians | 0.1 /100 | #286 | Tragic 53.5% |
| Immigrants | Belize | 0.1 /100 | #287 | Tragic 53.5% |
| Alaska Natives | 0.0 /100 | #288 | Tragic 53.4% |
| Immigrants | Ecuador | 0.0 /100 | #289 | Tragic 53.4% |
| Alaskan Athabascans | 0.0 /100 | #290 | Tragic 53.4% |
| Cubans | 0.0 /100 | #291 | Tragic 53.4% |
| Chickasaw | 0.0 /100 | #292 | Tragic 53.3% |
| Blacks/African Americans | 0.0 /100 | #293 | Tragic 53.3% |
Demographics Similar to Trinidadians and Tobagonians by College, 1 year or more
In terms of college, 1 year or more, the demographic groups most similar to Trinidadians and Tobagonians are French American Indian (55.8%, a difference of 0.050%), Puget Sound Salish (55.9%, a difference of 0.090%), Marshallese (55.8%, a difference of 0.15%), Osage (55.8%, a difference of 0.16%), and Chippewa (55.7%, a difference of 0.28%).
| Demographics | Rating | Rank | College, 1 year or more |
| Immigrants | Nonimmigrants | 2.5 /100 | #233 | Tragic 56.5% |
| Spanish Americans | 1.8 /100 | #234 | Tragic 56.3% |
| West Indians | 1.8 /100 | #235 | Tragic 56.3% |
| Iroquois | 1.7 /100 | #236 | Tragic 56.2% |
| Samoans | 1.6 /100 | #237 | Tragic 56.2% |
| Barbadians | 1.3 /100 | #238 | Tragic 56.0% |
| Puget Sound Salish | 1.1 /100 | #239 | Tragic 55.9% |
| Trinidadians and Tobagonians | 1.1 /100 | #240 | Tragic 55.8% |
| French American Indians | 1.0 /100 | #241 | Tragic 55.8% |
| Marshallese | 1.0 /100 | #242 | Tragic 55.8% |
| Osage | 1.0 /100 | #243 | Tragic 55.8% |
| Chippewa | 0.9 /100 | #244 | Tragic 55.7% |
| Immigrants | Liberia | 0.8 /100 | #245 | Tragic 55.7% |
| Malaysians | 0.8 /100 | #246 | Tragic 55.6% |
| Hawaiians | 0.8 /100 | #247 | Tragic 55.6% |