Tsimshian vs Trinidadian and Tobagonian College, 1 year or more
COMPARE
Tsimshian
Trinidadian and Tobagonian
College, 1 year or more
College, 1 year or more Comparison
Tsimshian
Trinidadians and Tobagonians
57.9%
COLLEGE, 1 YEAR OR MORE
13.5/ 100
METRIC RATING
210th/ 347
METRIC RANK
55.8%
COLLEGE, 1 YEAR OR MORE
1.1/ 100
METRIC RATING
240th/ 347
METRIC RANK
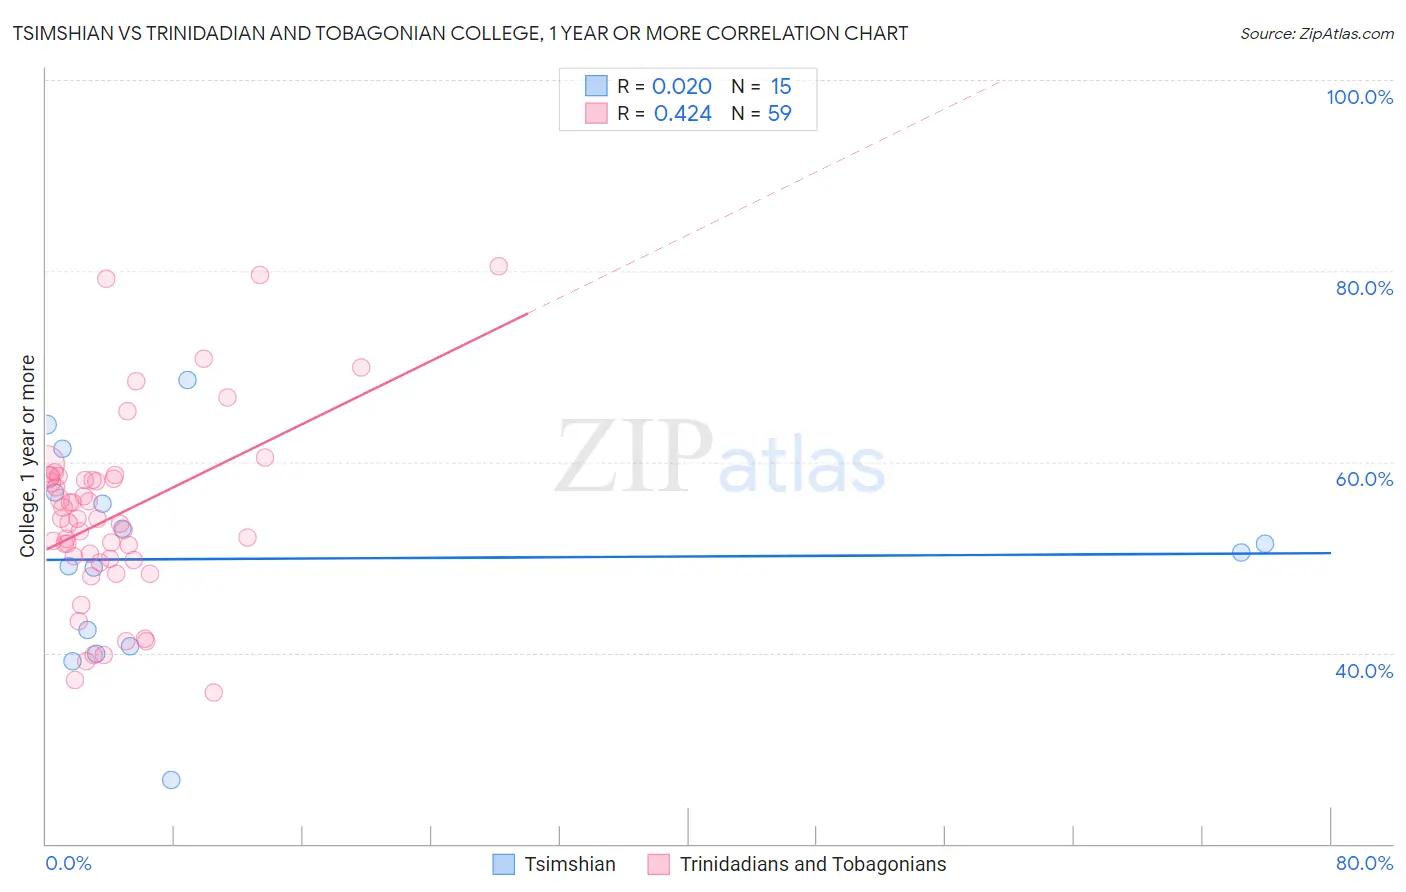
Tsimshian vs Trinidadian and Tobagonian College, 1 year or more Correlation Chart
The statistical analysis conducted on geographies consisting of 15,626,544 people shows no correlation between the proportion of Tsimshian and percentage of population with at least college, 1 year or more education in the United States with a correlation coefficient (R) of 0.020 and weighted average of 57.9%. Similarly, the statistical analysis conducted on geographies consisting of 219,882,137 people shows a moderate positive correlation between the proportion of Trinidadians and Tobagonians and percentage of population with at least college, 1 year or more education in the United States with a correlation coefficient (R) of 0.424 and weighted average of 55.8%, a difference of 3.8%.
College, 1 year or more Correlation Summary
| Measurement | Tsimshian | Trinidadian and Tobagonian |
| Minimum | 26.7% | 35.8% |
| Maximum | 68.6% | 80.5% |
| Range | 41.9% | 44.7% |
| Mean | 49.9% | 54.4% |
| Median | 50.5% | 54.0% |
| Interquartile 25% (IQ1) | 40.7% | 49.7% |
| Interquartile 75% (IQ3) | 56.8% | 58.4% |
| Interquartile Range (IQR) | 16.1% | 8.7% |
| Standard Deviation (Sample) | 10.9% | 9.7% |
| Standard Deviation (Population) | 10.6% | 9.6% |
Similar Demographics by College, 1 year or more
Demographics Similar to Tsimshian by College, 1 year or more
In terms of college, 1 year or more, the demographic groups most similar to Tsimshian are Immigrants from Nigeria (57.9%, a difference of 0.020%), Immigrants from Middle Africa (58.0%, a difference of 0.060%), Immigrants from Uruguay (58.1%, a difference of 0.19%), Immigrants from Senegal (57.8%, a difference of 0.20%), and French Canadian (57.8%, a difference of 0.20%).
| Demographics | Rating | Rank | College, 1 year or more |
| Ghanaians | 20.9 /100 | #203 | Fair 58.4% |
| Panamanians | 19.2 /100 | #204 | Poor 58.3% |
| Immigrants | Zaire | 18.7 /100 | #205 | Poor 58.3% |
| Immigrants | Vietnam | 18.2 /100 | #206 | Poor 58.2% |
| Senegalese | 16.9 /100 | #207 | Poor 58.2% |
| Immigrants | Uruguay | 15.2 /100 | #208 | Poor 58.1% |
| Immigrants | Middle Africa | 14.0 /100 | #209 | Poor 58.0% |
| Tsimshian | 13.5 /100 | #210 | Poor 57.9% |
| Immigrants | Nigeria | 13.3 /100 | #211 | Poor 57.9% |
| Immigrants | Senegal | 11.8 /100 | #212 | Poor 57.8% |
| French Canadians | 11.8 /100 | #213 | Poor 57.8% |
| Immigrants | Colombia | 11.6 /100 | #214 | Poor 57.8% |
| Tongans | 11.6 /100 | #215 | Poor 57.8% |
| Immigrants | Peru | 10.6 /100 | #216 | Poor 57.7% |
| Immigrants | Panama | 9.1 /100 | #217 | Tragic 57.6% |
Demographics Similar to Trinidadians and Tobagonians by College, 1 year or more
In terms of college, 1 year or more, the demographic groups most similar to Trinidadians and Tobagonians are French American Indian (55.8%, a difference of 0.050%), Puget Sound Salish (55.9%, a difference of 0.090%), Marshallese (55.8%, a difference of 0.15%), Osage (55.8%, a difference of 0.16%), and Chippewa (55.7%, a difference of 0.28%).
| Demographics | Rating | Rank | College, 1 year or more |
| Immigrants | Nonimmigrants | 2.5 /100 | #233 | Tragic 56.5% |
| Spanish Americans | 1.8 /100 | #234 | Tragic 56.3% |
| West Indians | 1.8 /100 | #235 | Tragic 56.3% |
| Iroquois | 1.7 /100 | #236 | Tragic 56.2% |
| Samoans | 1.6 /100 | #237 | Tragic 56.2% |
| Barbadians | 1.3 /100 | #238 | Tragic 56.0% |
| Puget Sound Salish | 1.1 /100 | #239 | Tragic 55.9% |
| Trinidadians and Tobagonians | 1.1 /100 | #240 | Tragic 55.8% |
| French American Indians | 1.0 /100 | #241 | Tragic 55.8% |
| Marshallese | 1.0 /100 | #242 | Tragic 55.8% |
| Osage | 1.0 /100 | #243 | Tragic 55.8% |
| Chippewa | 0.9 /100 | #244 | Tragic 55.7% |
| Immigrants | Liberia | 0.8 /100 | #245 | Tragic 55.7% |
| Malaysians | 0.8 /100 | #246 | Tragic 55.6% |
| Hawaiians | 0.8 /100 | #247 | Tragic 55.6% |