Croatian vs Nigerian College, 1 year or more
COMPARE
Croatian
Nigerian
College, 1 year or more
College, 1 year or more Comparison
Croatians
Nigerians
62.2%
COLLEGE, 1 YEAR OR MORE
97.1/ 100
METRIC RATING
99th/ 347
METRIC RANK
58.5%
COLLEGE, 1 YEAR OR MORE
23.0/ 100
METRIC RATING
201st/ 347
METRIC RANK
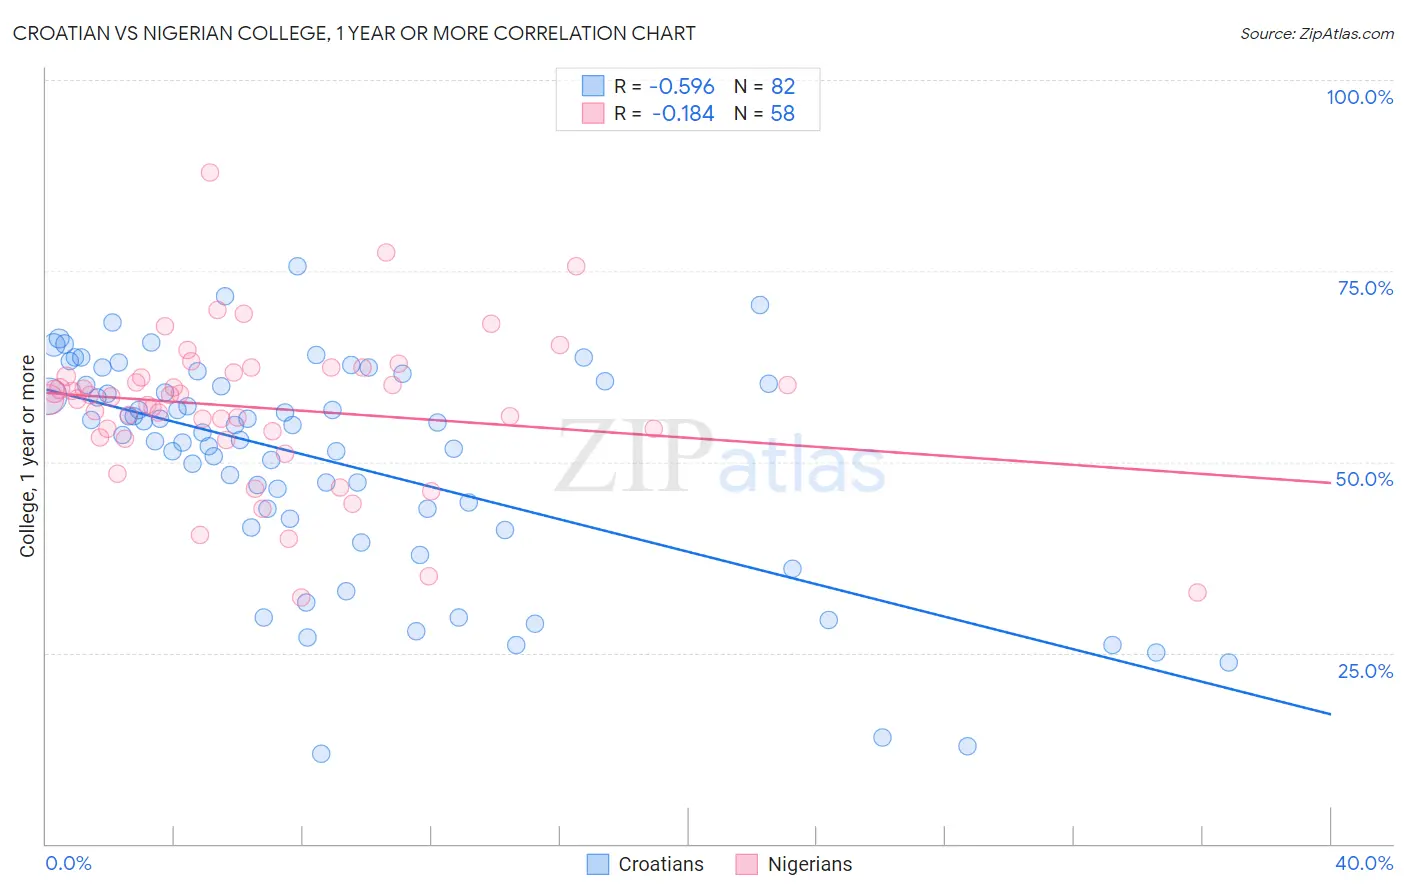
Croatian vs Nigerian College, 1 year or more Correlation Chart
The statistical analysis conducted on geographies consisting of 375,729,085 people shows a substantial negative correlation between the proportion of Croatians and percentage of population with at least college, 1 year or more education in the United States with a correlation coefficient (R) of -0.596 and weighted average of 62.2%. Similarly, the statistical analysis conducted on geographies consisting of 332,779,766 people shows a poor negative correlation between the proportion of Nigerians and percentage of population with at least college, 1 year or more education in the United States with a correlation coefficient (R) of -0.184 and weighted average of 58.5%, a difference of 6.4%.
College, 1 year or more Correlation Summary
| Measurement | Croatian | Nigerian |
| Minimum | 11.7% | 32.3% |
| Maximum | 75.6% | 87.8% |
| Range | 63.8% | 55.5% |
| Mean | 50.1% | 57.1% |
| Median | 54.4% | 58.4% |
| Interquartile 25% (IQ1) | 42.5% | 53.2% |
| Interquartile 75% (IQ3) | 60.2% | 61.7% |
| Interquartile Range (IQR) | 17.6% | 8.5% |
| Standard Deviation (Sample) | 14.4% | 10.1% |
| Standard Deviation (Population) | 14.3% | 10.0% |
Similar Demographics by College, 1 year or more
Demographics Similar to Croatians by College, 1 year or more
In terms of college, 1 year or more, the demographic groups most similar to Croatians are Carpatho Rusyn (62.2%, a difference of 0.0%), Chinese (62.2%, a difference of 0.010%), Jordanian (62.2%, a difference of 0.010%), British (62.3%, a difference of 0.13%), and Icelander (62.1%, a difference of 0.16%).
| Demographics | Rating | Rank | College, 1 year or more |
| Immigrants | Egypt | 97.8 /100 | #92 | Exceptional 62.4% |
| Romanians | 97.7 /100 | #93 | Exceptional 62.4% |
| Immigrants | Croatia | 97.6 /100 | #94 | Exceptional 62.3% |
| British | 97.4 /100 | #95 | Exceptional 62.3% |
| Chinese | 97.2 /100 | #96 | Exceptional 62.2% |
| Jordanians | 97.2 /100 | #97 | Exceptional 62.2% |
| Carpatho Rusyns | 97.2 /100 | #98 | Exceptional 62.2% |
| Croatians | 97.1 /100 | #99 | Exceptional 62.2% |
| Icelanders | 96.8 /100 | #100 | Exceptional 62.1% |
| Swedes | 96.8 /100 | #101 | Exceptional 62.1% |
| Luxembourgers | 96.7 /100 | #102 | Exceptional 62.1% |
| Afghans | 96.4 /100 | #103 | Exceptional 62.0% |
| Chileans | 96.4 /100 | #104 | Exceptional 62.0% |
| Immigrants | Nepal | 96.3 /100 | #105 | Exceptional 62.0% |
| Palestinians | 96.3 /100 | #106 | Exceptional 62.0% |
Demographics Similar to Nigerians by College, 1 year or more
In terms of college, 1 year or more, the demographic groups most similar to Nigerians are Immigrants from South America (58.4%, a difference of 0.080%), Spanish (58.5%, a difference of 0.090%), Slovak (58.5%, a difference of 0.12%), Immigrants from South Eastern Asia (58.5%, a difference of 0.15%), and Ghanaian (58.4%, a difference of 0.17%).
| Demographics | Rating | Rank | College, 1 year or more |
| Costa Ricans | 26.4 /100 | #194 | Fair 58.6% |
| Dutch | 26.2 /100 | #195 | Fair 58.6% |
| Guamanians/Chamorros | 26.2 /100 | #196 | Fair 58.6% |
| Immigrants | Thailand | 26.0 /100 | #197 | Fair 58.6% |
| Immigrants | South Eastern Asia | 25.1 /100 | #198 | Fair 58.5% |
| Slovaks | 24.6 /100 | #199 | Fair 58.5% |
| Spanish | 24.2 /100 | #200 | Fair 58.5% |
| Nigerians | 23.0 /100 | #201 | Fair 58.5% |
| Immigrants | South America | 21.9 /100 | #202 | Fair 58.4% |
| Ghanaians | 20.9 /100 | #203 | Fair 58.4% |
| Panamanians | 19.2 /100 | #204 | Poor 58.3% |
| Immigrants | Zaire | 18.7 /100 | #205 | Poor 58.3% |
| Immigrants | Vietnam | 18.2 /100 | #206 | Poor 58.2% |
| Senegalese | 16.9 /100 | #207 | Poor 58.2% |
| Immigrants | Uruguay | 15.2 /100 | #208 | Poor 58.1% |