Croatian vs Trinidadian and Tobagonian 10th Grade
COMPARE
Croatian
Trinidadian and Tobagonian
10th Grade
10th Grade Comparison
Croatians
Trinidadians and Tobagonians
95.7%
10TH GRADE
100.0/ 100
METRIC RATING
10th/ 347
METRIC RANK
92.4%
10TH GRADE
0.2/ 100
METRIC RATING
273rd/ 347
METRIC RANK
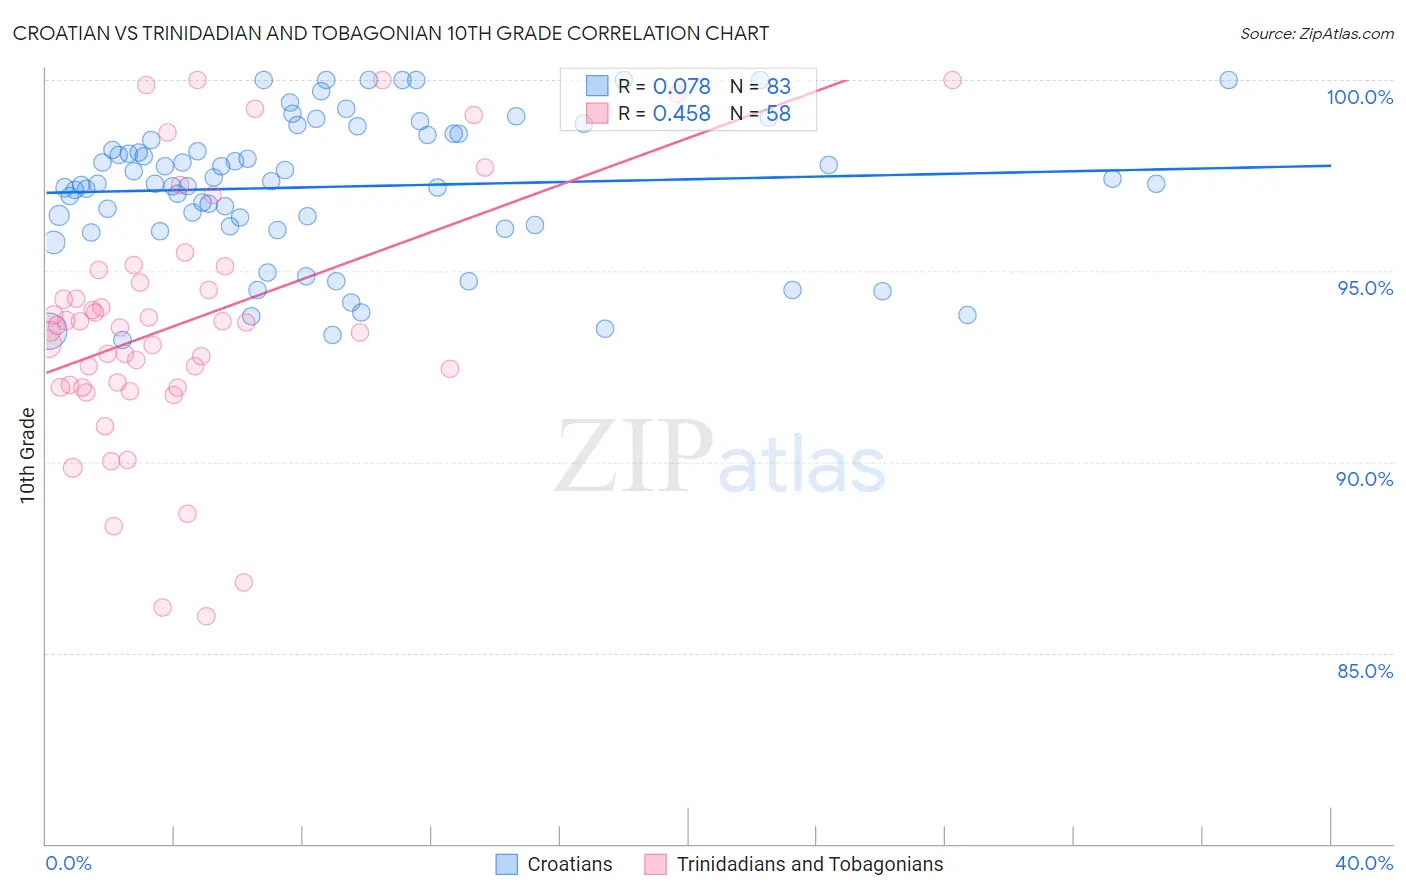
Croatian vs Trinidadian and Tobagonian 10th Grade Correlation Chart
The statistical analysis conducted on geographies consisting of 375,734,264 people shows a slight positive correlation between the proportion of Croatians and percentage of population with at least 10th grade education in the United States with a correlation coefficient (R) of 0.078 and weighted average of 95.7%. Similarly, the statistical analysis conducted on geographies consisting of 219,881,170 people shows a moderate positive correlation between the proportion of Trinidadians and Tobagonians and percentage of population with at least 10th grade education in the United States with a correlation coefficient (R) of 0.458 and weighted average of 92.4%, a difference of 3.6%.
10th Grade Correlation Summary
| Measurement | Croatian | Trinidadian and Tobagonian |
| Minimum | 93.2% | 86.0% |
| Maximum | 100.0% | 100.0% |
| Range | 6.8% | 14.0% |
| Mean | 97.2% | 93.7% |
| Median | 97.3% | 93.5% |
| Interquartile 25% (IQ1) | 96.2% | 92.0% |
| Interquartile 75% (IQ3) | 98.6% | 95.0% |
| Interquartile Range (IQR) | 2.4% | 3.1% |
| Standard Deviation (Sample) | 1.8% | 3.3% |
| Standard Deviation (Population) | 1.8% | 3.3% |
Similar Demographics by 10th Grade
Demographics Similar to Croatians by 10th Grade
In terms of 10th grade, the demographic groups most similar to Croatians are Finnish (95.8%, a difference of 0.020%), Danish (95.7%, a difference of 0.040%), Lithuanian (95.8%, a difference of 0.080%), Tlingit-Haida (95.7%, a difference of 0.080%), and German (95.8%, a difference of 0.090%).
| Demographics | Rating | Rank | 10th Grade |
| Slovenes | 100.0 /100 | #3 | Exceptional 95.9% |
| Swedes | 100.0 /100 | #4 | Exceptional 95.9% |
| Carpatho Rusyns | 100.0 /100 | #5 | Exceptional 95.9% |
| Poles | 100.0 /100 | #6 | Exceptional 95.8% |
| Germans | 100.0 /100 | #7 | Exceptional 95.8% |
| Lithuanians | 100.0 /100 | #8 | Exceptional 95.8% |
| Finns | 100.0 /100 | #9 | Exceptional 95.8% |
| Croatians | 100.0 /100 | #10 | Exceptional 95.7% |
| Danes | 100.0 /100 | #11 | Exceptional 95.7% |
| Tlingit-Haida | 100.0 /100 | #12 | Exceptional 95.7% |
| English | 100.0 /100 | #13 | Exceptional 95.6% |
| Tsimshian | 100.0 /100 | #14 | Exceptional 95.6% |
| Irish | 100.0 /100 | #15 | Exceptional 95.6% |
| Scottish | 100.0 /100 | #16 | Exceptional 95.6% |
| Latvians | 100.0 /100 | #17 | Exceptional 95.6% |
Demographics Similar to Trinidadians and Tobagonians by 10th Grade
In terms of 10th grade, the demographic groups most similar to Trinidadians and Tobagonians are Immigrants from Congo (92.4%, a difference of 0.010%), West Indian (92.4%, a difference of 0.010%), Immigrants from Western Africa (92.5%, a difference of 0.070%), Immigrants from Eritrea (92.5%, a difference of 0.080%), and Immigrants from Colombia (92.5%, a difference of 0.090%).
| Demographics | Rating | Rank | 10th Grade |
| Immigrants | Philippines | 0.4 /100 | #266 | Tragic 92.6% |
| Taiwanese | 0.3 /100 | #267 | Tragic 92.5% |
| Immigrants | Ghana | 0.3 /100 | #268 | Tragic 92.5% |
| Immigrants | Colombia | 0.3 /100 | #269 | Tragic 92.5% |
| Immigrants | Uruguay | 0.3 /100 | #270 | Tragic 92.5% |
| Immigrants | Eritrea | 0.3 /100 | #271 | Tragic 92.5% |
| Immigrants | Western Africa | 0.3 /100 | #272 | Tragic 92.5% |
| Trinidadians and Tobagonians | 0.2 /100 | #273 | Tragic 92.4% |
| Immigrants | Congo | 0.2 /100 | #274 | Tragic 92.4% |
| West Indians | 0.2 /100 | #275 | Tragic 92.4% |
| Immigrants | Trinidad and Tobago | 0.1 /100 | #276 | Tragic 92.3% |
| Navajo | 0.1 /100 | #277 | Tragic 92.3% |
| Barbadians | 0.1 /100 | #278 | Tragic 92.2% |
| Natives/Alaskans | 0.1 /100 | #279 | Tragic 92.2% |
| Malaysians | 0.1 /100 | #280 | Tragic 92.2% |