Costa Rican vs Nonimmigrants College, 1 year or more
COMPARE
Costa Rican
Nonimmigrants
College, 1 year or more
College, 1 year or more Comparison
Costa Ricans
Nonimmigrants
58.6%
COLLEGE, 1 YEAR OR MORE
26.4/ 100
METRIC RATING
194th/ 347
METRIC RANK
56.5%
COLLEGE, 1 YEAR OR MORE
2.5/ 100
METRIC RATING
233rd/ 347
METRIC RANK
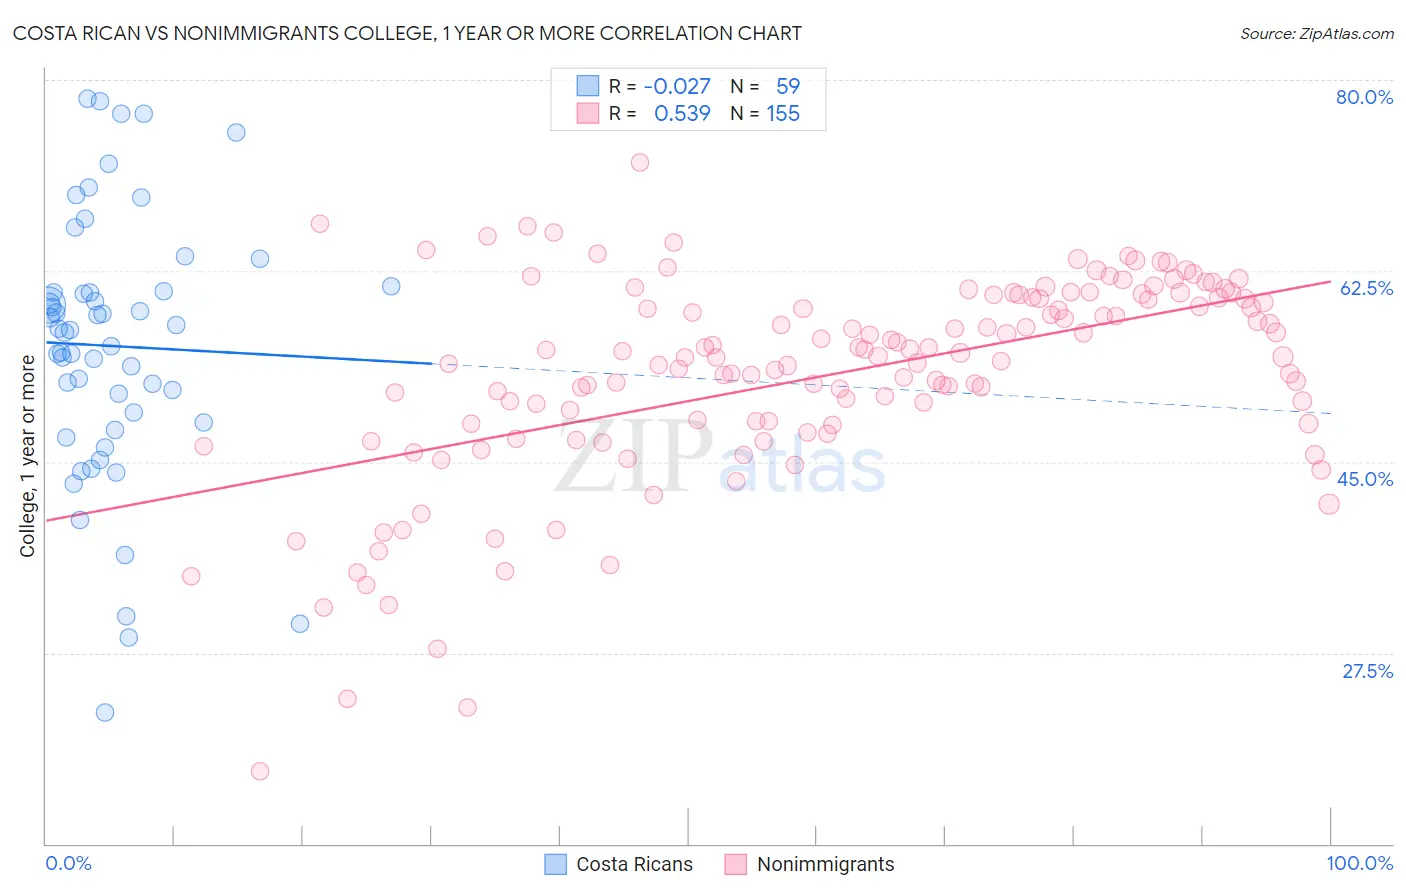
Costa Rican vs Nonimmigrants College, 1 year or more Correlation Chart
The statistical analysis conducted on geographies consisting of 253,601,897 people shows no correlation between the proportion of Costa Ricans and percentage of population with at least college, 1 year or more education in the United States with a correlation coefficient (R) of -0.027 and weighted average of 58.6%. Similarly, the statistical analysis conducted on geographies consisting of 585,276,448 people shows a substantial positive correlation between the proportion of Nonimmigrants and percentage of population with at least college, 1 year or more education in the United States with a correlation coefficient (R) of 0.539 and weighted average of 56.5%, a difference of 3.7%.
College, 1 year or more Correlation Summary
| Measurement | Costa Rican | Nonimmigrants |
| Minimum | 22.0% | 16.7% |
| Maximum | 78.3% | 72.4% |
| Range | 56.3% | 55.7% |
| Mean | 55.6% | 52.9% |
| Median | 57.1% | 54.6% |
| Interquartile 25% (IQ1) | 48.6% | 48.5% |
| Interquartile 75% (IQ3) | 60.6% | 60.0% |
| Interquartile Range (IQR) | 12.0% | 11.5% |
| Standard Deviation (Sample) | 12.1% | 9.4% |
| Standard Deviation (Population) | 12.0% | 9.4% |
Similar Demographics by College, 1 year or more
Demographics Similar to Costa Ricans by College, 1 year or more
In terms of college, 1 year or more, the demographic groups most similar to Costa Ricans are Dutch (58.6%, a difference of 0.020%), Guamanian/Chamorro (58.6%, a difference of 0.020%), Immigrants from Thailand (58.6%, a difference of 0.030%), Peruvian (58.6%, a difference of 0.070%), and Colombian (58.7%, a difference of 0.080%).
| Demographics | Rating | Rank | College, 1 year or more |
| Germans | 34.7 /100 | #187 | Fair 58.9% |
| French | 34.4 /100 | #188 | Fair 58.9% |
| Uruguayans | 31.8 /100 | #189 | Fair 58.8% |
| Immigrants | Cameroon | 31.2 /100 | #190 | Fair 58.8% |
| Immigrants | Philippines | 29.2 /100 | #191 | Fair 58.7% |
| Colombians | 27.6 /100 | #192 | Fair 58.7% |
| Peruvians | 27.5 /100 | #193 | Fair 58.6% |
| Costa Ricans | 26.4 /100 | #194 | Fair 58.6% |
| Dutch | 26.2 /100 | #195 | Fair 58.6% |
| Guamanians/Chamorros | 26.2 /100 | #196 | Fair 58.6% |
| Immigrants | Thailand | 26.0 /100 | #197 | Fair 58.6% |
| Immigrants | South Eastern Asia | 25.1 /100 | #198 | Fair 58.5% |
| Slovaks | 24.6 /100 | #199 | Fair 58.5% |
| Spanish | 24.2 /100 | #200 | Fair 58.5% |
| Nigerians | 23.0 /100 | #201 | Fair 58.5% |
Demographics Similar to Nonimmigrants by College, 1 year or more
In terms of college, 1 year or more, the demographic groups most similar to Nonimmigrants are Immigrants from Bangladesh (56.6%, a difference of 0.090%), Immigrants from Burma/Myanmar (56.6%, a difference of 0.15%), Liberian (56.7%, a difference of 0.34%), Spanish American (56.3%, a difference of 0.45%), and West Indian (56.3%, a difference of 0.45%).
| Demographics | Rating | Rank | College, 1 year or more |
| Immigrants | Western Africa | 4.6 /100 | #226 | Tragic 57.0% |
| Immigrants | Immigrants | 4.4 /100 | #227 | Tragic 57.0% |
| Immigrants | Fiji | 4.0 /100 | #228 | Tragic 56.9% |
| Cree | 3.6 /100 | #229 | Tragic 56.8% |
| Liberians | 3.1 /100 | #230 | Tragic 56.7% |
| Immigrants | Burma/Myanmar | 2.7 /100 | #231 | Tragic 56.6% |
| Immigrants | Bangladesh | 2.6 /100 | #232 | Tragic 56.6% |
| Immigrants | Nonimmigrants | 2.5 /100 | #233 | Tragic 56.5% |
| Spanish Americans | 1.8 /100 | #234 | Tragic 56.3% |
| West Indians | 1.8 /100 | #235 | Tragic 56.3% |
| Iroquois | 1.7 /100 | #236 | Tragic 56.2% |
| Samoans | 1.6 /100 | #237 | Tragic 56.2% |
| Barbadians | 1.3 /100 | #238 | Tragic 56.0% |
| Puget Sound Salish | 1.1 /100 | #239 | Tragic 55.9% |
| Trinidadians and Tobagonians | 1.1 /100 | #240 | Tragic 55.8% |