Costa Rican vs Nonimmigrants Currently Married
COMPARE
Costa Rican
Nonimmigrants
Currently Married
Currently Married Comparison
Costa Ricans
Nonimmigrants
46.5%
CURRENTLY MARRIED
43.7/ 100
METRIC RATING
180th/ 347
METRIC RANK
46.9%
CURRENTLY MARRIED
65.4/ 100
METRIC RATING
162nd/ 347
METRIC RANK
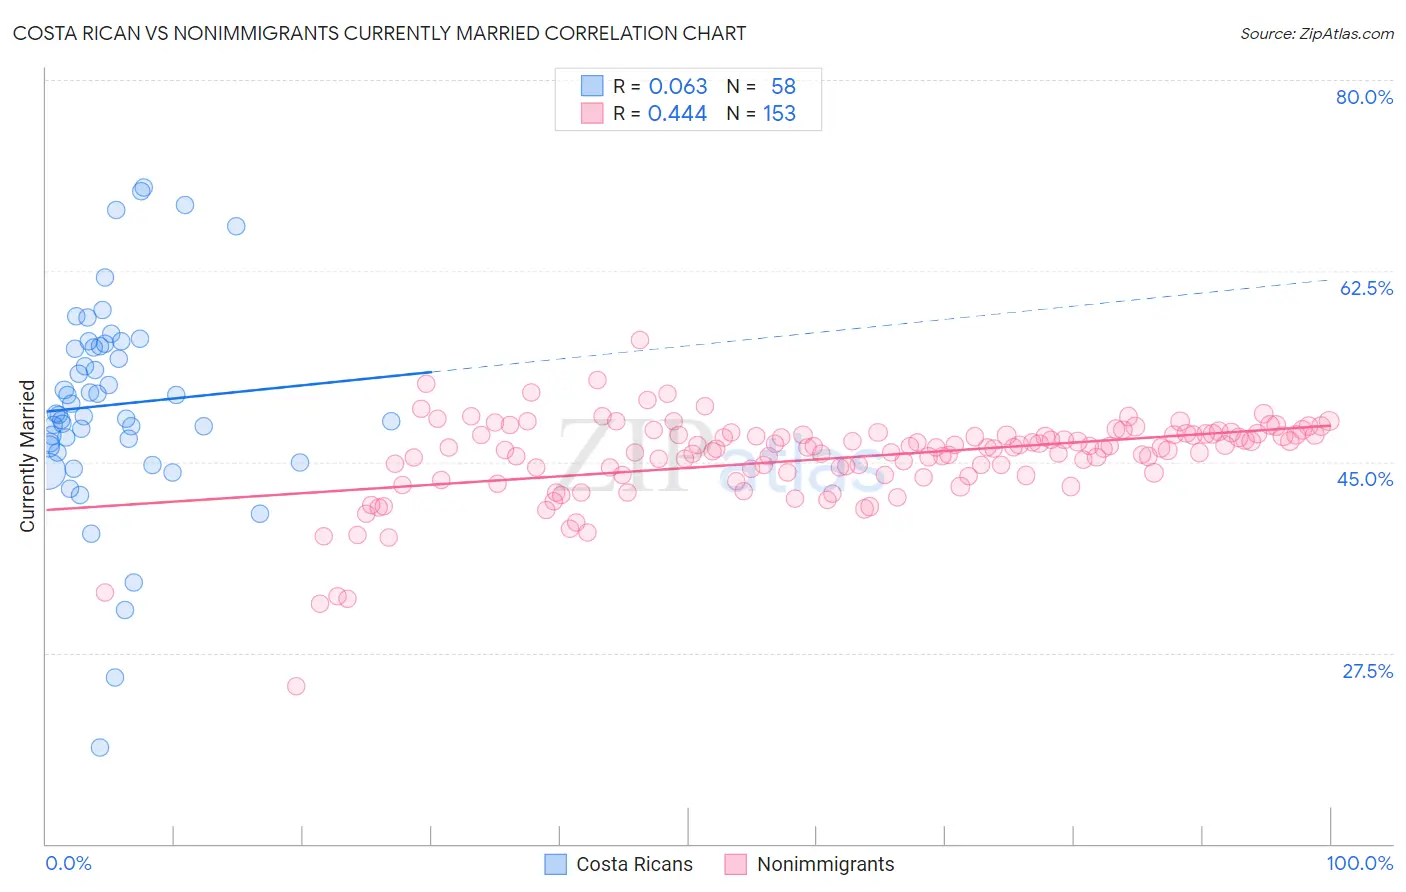
Costa Rican vs Nonimmigrants Currently Married Correlation Chart
The statistical analysis conducted on geographies consisting of 253,590,013 people shows a slight positive correlation between the proportion of Costa Ricans and percentage of population currently married in the United States with a correlation coefficient (R) of 0.063 and weighted average of 46.5%. Similarly, the statistical analysis conducted on geographies consisting of 585,180,453 people shows a moderate positive correlation between the proportion of Nonimmigrants and percentage of population currently married in the United States with a correlation coefficient (R) of 0.444 and weighted average of 46.9%, a difference of 0.82%.
Currently Married Correlation Summary
| Measurement | Costa Rican | Nonimmigrants |
| Minimum | 18.8% | 24.5% |
| Maximum | 70.1% | 56.2% |
| Range | 51.3% | 31.7% |
| Mean | 50.2% | 45.3% |
| Median | 49.4% | 46.3% |
| Interquartile 25% (IQ1) | 46.5% | 43.8% |
| Interquartile 75% (IQ3) | 55.6% | 47.5% |
| Interquartile Range (IQR) | 9.1% | 3.7% |
| Standard Deviation (Sample) | 9.6% | 4.0% |
| Standard Deviation (Population) | 9.5% | 4.0% |
Demographics Similar to Costa Ricans and Nonimmigrants by Currently Married
In terms of currently married, the demographic groups most similar to Costa Ricans are Ottawa (46.5%, a difference of 0.020%), Immigrants from Oceania (46.5%, a difference of 0.030%), Chickasaw (46.6%, a difference of 0.15%), Hawaiian (46.6%, a difference of 0.18%), and Israeli (46.6%, a difference of 0.18%). Similarly, the demographic groups most similar to Nonimmigrants are Immigrants from Southern Europe (46.9%, a difference of 0.020%), Delaware (46.9%, a difference of 0.030%), Immigrants from Western Asia (46.9%, a difference of 0.050%), Samoan (46.8%, a difference of 0.22%), and Immigrants from Syria (46.8%, a difference of 0.24%).
| Demographics | Rating | Rank | Currently Married |
| Immigrants | Southern Europe | 65.9 /100 | #161 | Good 46.9% |
| Immigrants | Nonimmigrants | 65.4 /100 | #162 | Good 46.9% |
| Delaware | 64.7 /100 | #163 | Good 46.9% |
| Immigrants | Western Asia | 64.2 /100 | #164 | Good 46.9% |
| Samoans | 59.8 /100 | #165 | Average 46.8% |
| Immigrants | Syria | 59.3 /100 | #166 | Average 46.8% |
| Spaniards | 58.8 /100 | #167 | Average 46.8% |
| Immigrants | Afghanistan | 58.2 /100 | #168 | Average 46.8% |
| Armenians | 58.2 /100 | #169 | Average 46.8% |
| Immigrants | Latvia | 56.7 /100 | #170 | Average 46.7% |
| Immigrants | Zimbabwe | 52.4 /100 | #171 | Average 46.7% |
| Aleuts | 52.0 /100 | #172 | Average 46.7% |
| Tlingit-Haida | 51.2 /100 | #173 | Average 46.7% |
| Peruvians | 50.0 /100 | #174 | Average 46.6% |
| Immigrants | Brazil | 49.9 /100 | #175 | Average 46.6% |
| Hawaiians | 48.6 /100 | #176 | Average 46.6% |
| Israelis | 48.6 /100 | #177 | Average 46.6% |
| Chickasaw | 47.8 /100 | #178 | Average 46.6% |
| Immigrants | Oceania | 44.6 /100 | #179 | Average 46.5% |
| Costa Ricans | 43.7 /100 | #180 | Average 46.5% |
| Ottawa | 43.0 /100 | #181 | Average 46.5% |