Costa Rican vs Houma College, 1 year or more
COMPARE
Costa Rican
Houma
College, 1 year or more
College, 1 year or more Comparison
Costa Ricans
Houma
58.6%
COLLEGE, 1 YEAR OR MORE
26.4/ 100
METRIC RATING
194th/ 347
METRIC RANK
41.2%
COLLEGE, 1 YEAR OR MORE
0.0/ 100
METRIC RATING
346th/ 347
METRIC RANK
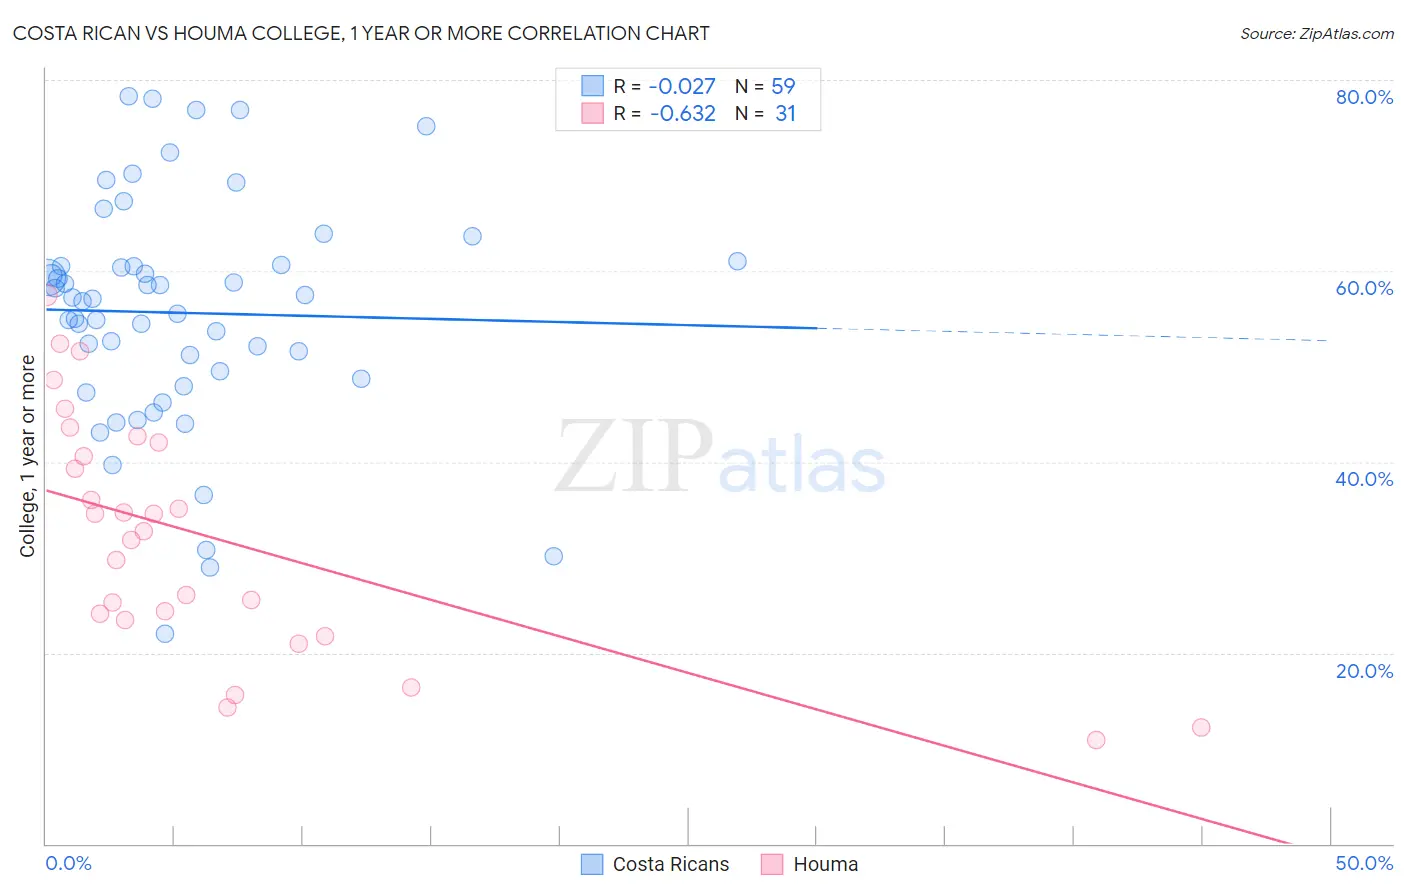
Costa Rican vs Houma College, 1 year or more Correlation Chart
The statistical analysis conducted on geographies consisting of 253,601,897 people shows no correlation between the proportion of Costa Ricans and percentage of population with at least college, 1 year or more education in the United States with a correlation coefficient (R) of -0.027 and weighted average of 58.6%. Similarly, the statistical analysis conducted on geographies consisting of 36,795,542 people shows a significant negative correlation between the proportion of Houma and percentage of population with at least college, 1 year or more education in the United States with a correlation coefficient (R) of -0.632 and weighted average of 41.2%, a difference of 42.2%.
College, 1 year or more Correlation Summary
| Measurement | Costa Rican | Houma |
| Minimum | 22.0% | 10.8% |
| Maximum | 78.3% | 57.5% |
| Range | 56.3% | 46.7% |
| Mean | 55.6% | 32.1% |
| Median | 57.1% | 32.7% |
| Interquartile 25% (IQ1) | 48.6% | 23.5% |
| Interquartile 75% (IQ3) | 60.6% | 42.0% |
| Interquartile Range (IQR) | 12.0% | 18.6% |
| Standard Deviation (Sample) | 12.1% | 12.4% |
| Standard Deviation (Population) | 12.0% | 12.2% |
Similar Demographics by College, 1 year or more
Demographics Similar to Costa Ricans by College, 1 year or more
In terms of college, 1 year or more, the demographic groups most similar to Costa Ricans are Dutch (58.6%, a difference of 0.020%), Guamanian/Chamorro (58.6%, a difference of 0.020%), Immigrants from Thailand (58.6%, a difference of 0.030%), Peruvian (58.6%, a difference of 0.070%), and Colombian (58.7%, a difference of 0.080%).
| Demographics | Rating | Rank | College, 1 year or more |
| Germans | 34.7 /100 | #187 | Fair 58.9% |
| French | 34.4 /100 | #188 | Fair 58.9% |
| Uruguayans | 31.8 /100 | #189 | Fair 58.8% |
| Immigrants | Cameroon | 31.2 /100 | #190 | Fair 58.8% |
| Immigrants | Philippines | 29.2 /100 | #191 | Fair 58.7% |
| Colombians | 27.6 /100 | #192 | Fair 58.7% |
| Peruvians | 27.5 /100 | #193 | Fair 58.6% |
| Costa Ricans | 26.4 /100 | #194 | Fair 58.6% |
| Dutch | 26.2 /100 | #195 | Fair 58.6% |
| Guamanians/Chamorros | 26.2 /100 | #196 | Fair 58.6% |
| Immigrants | Thailand | 26.0 /100 | #197 | Fair 58.6% |
| Immigrants | South Eastern Asia | 25.1 /100 | #198 | Fair 58.5% |
| Slovaks | 24.6 /100 | #199 | Fair 58.5% |
| Spanish | 24.2 /100 | #200 | Fair 58.5% |
| Nigerians | 23.0 /100 | #201 | Fair 58.5% |
Demographics Similar to Houma by College, 1 year or more
In terms of college, 1 year or more, the demographic groups most similar to Houma are Yup'ik (39.4%, a difference of 4.5%), Pima (45.6%, a difference of 10.7%), Yakama (46.2%, a difference of 12.2%), Tohono O'odham (47.1%, a difference of 14.4%), and Inupiat (47.2%, a difference of 14.6%).
| Demographics | Rating | Rank | College, 1 year or more |
| Immigrants | Dominican Republic | 0.0 /100 | #333 | Tragic 49.1% |
| Lumbee | 0.0 /100 | #334 | Tragic 48.9% |
| Yuman | 0.0 /100 | #335 | Tragic 48.7% |
| Spanish American Indians | 0.0 /100 | #336 | Tragic 48.5% |
| Pennsylvania Germans | 0.0 /100 | #337 | Tragic 48.5% |
| Immigrants | Central America | 0.0 /100 | #338 | Tragic 48.5% |
| Immigrants | Azores | 0.0 /100 | #339 | Tragic 48.4% |
| Immigrants | Cabo Verde | 0.0 /100 | #340 | Tragic 48.1% |
| Immigrants | Mexico | 0.0 /100 | #341 | Tragic 47.5% |
| Inupiat | 0.0 /100 | #342 | Tragic 47.2% |
| Tohono O'odham | 0.0 /100 | #343 | Tragic 47.1% |
| Yakama | 0.0 /100 | #344 | Tragic 46.2% |
| Pima | 0.0 /100 | #345 | Tragic 45.6% |
| Houma | 0.0 /100 | #346 | Tragic 41.2% |
| Yup'ik | 0.0 /100 | #347 | Tragic 39.4% |