Costa Rican vs Immigrants from El Salvador College, 1 year or more
COMPARE
Costa Rican
Immigrants from El Salvador
College, 1 year or more
College, 1 year or more Comparison
Costa Ricans
Immigrants from El Salvador
58.6%
COLLEGE, 1 YEAR OR MORE
26.4/ 100
METRIC RATING
194th/ 347
METRIC RANK
51.0%
COLLEGE, 1 YEAR OR MORE
0.0/ 100
METRIC RATING
319th/ 347
METRIC RANK
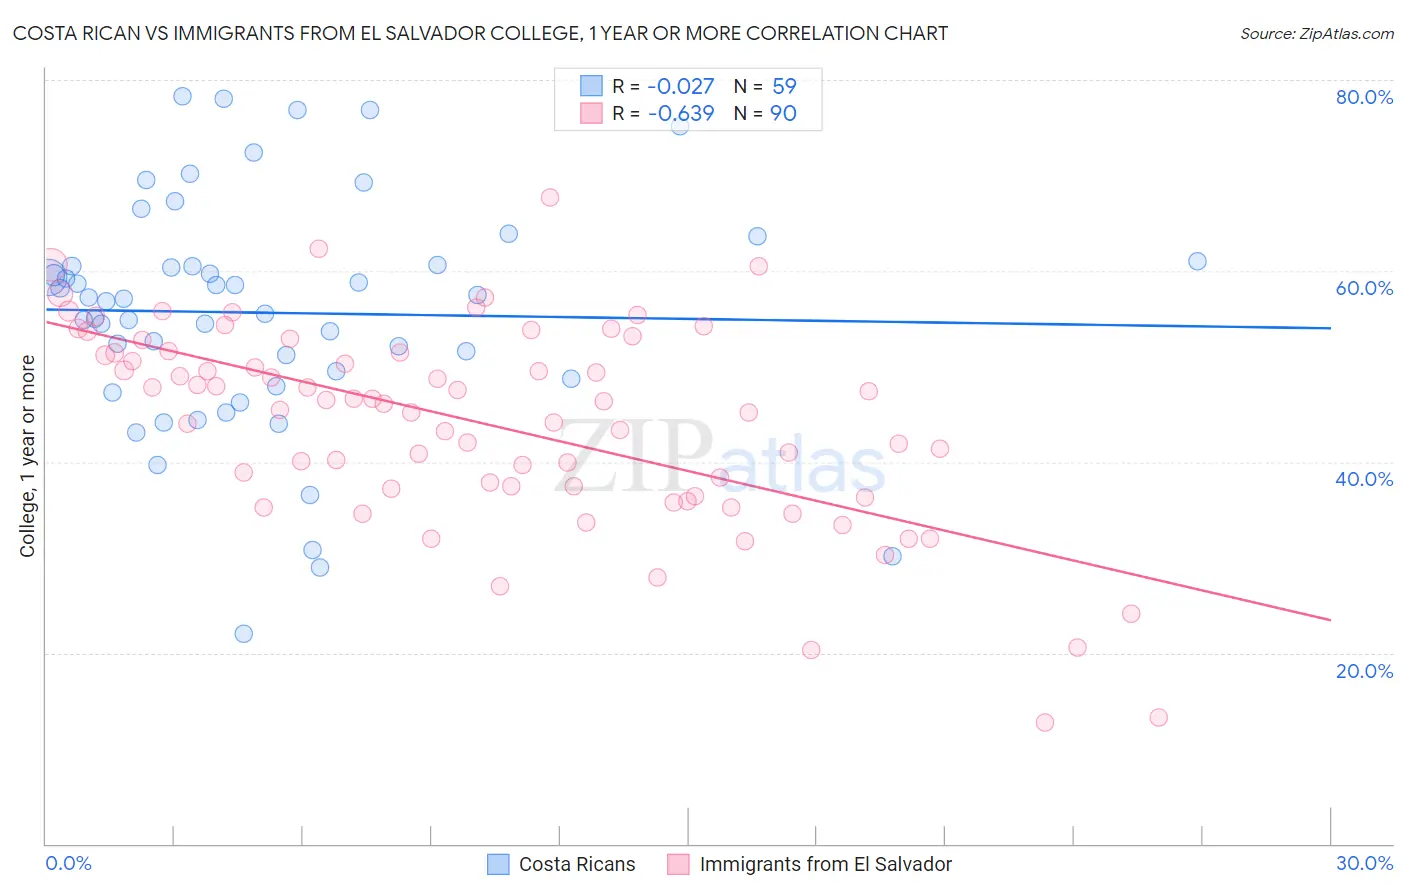
Costa Rican vs Immigrants from El Salvador College, 1 year or more Correlation Chart
The statistical analysis conducted on geographies consisting of 253,601,897 people shows no correlation between the proportion of Costa Ricans and percentage of population with at least college, 1 year or more education in the United States with a correlation coefficient (R) of -0.027 and weighted average of 58.6%. Similarly, the statistical analysis conducted on geographies consisting of 357,850,135 people shows a significant negative correlation between the proportion of Immigrants from El Salvador and percentage of population with at least college, 1 year or more education in the United States with a correlation coefficient (R) of -0.639 and weighted average of 51.0%, a difference of 14.9%.
College, 1 year or more Correlation Summary
| Measurement | Costa Rican | Immigrants from El Salvador |
| Minimum | 22.0% | 12.7% |
| Maximum | 78.3% | 67.7% |
| Range | 56.3% | 55.1% |
| Mean | 55.6% | 44.0% |
| Median | 57.1% | 46.3% |
| Interquartile 25% (IQ1) | 48.6% | 37.2% |
| Interquartile 75% (IQ3) | 60.6% | 51.5% |
| Interquartile Range (IQR) | 12.0% | 14.3% |
| Standard Deviation (Sample) | 12.1% | 10.6% |
| Standard Deviation (Population) | 12.0% | 10.5% |
Similar Demographics by College, 1 year or more
Demographics Similar to Costa Ricans by College, 1 year or more
In terms of college, 1 year or more, the demographic groups most similar to Costa Ricans are Dutch (58.6%, a difference of 0.020%), Guamanian/Chamorro (58.6%, a difference of 0.020%), Immigrants from Thailand (58.6%, a difference of 0.030%), Peruvian (58.6%, a difference of 0.070%), and Colombian (58.7%, a difference of 0.080%).
| Demographics | Rating | Rank | College, 1 year or more |
| Germans | 34.7 /100 | #187 | Fair 58.9% |
| French | 34.4 /100 | #188 | Fair 58.9% |
| Uruguayans | 31.8 /100 | #189 | Fair 58.8% |
| Immigrants | Cameroon | 31.2 /100 | #190 | Fair 58.8% |
| Immigrants | Philippines | 29.2 /100 | #191 | Fair 58.7% |
| Colombians | 27.6 /100 | #192 | Fair 58.7% |
| Peruvians | 27.5 /100 | #193 | Fair 58.6% |
| Costa Ricans | 26.4 /100 | #194 | Fair 58.6% |
| Dutch | 26.2 /100 | #195 | Fair 58.6% |
| Guamanians/Chamorros | 26.2 /100 | #196 | Fair 58.6% |
| Immigrants | Thailand | 26.0 /100 | #197 | Fair 58.6% |
| Immigrants | South Eastern Asia | 25.1 /100 | #198 | Fair 58.5% |
| Slovaks | 24.6 /100 | #199 | Fair 58.5% |
| Spanish | 24.2 /100 | #200 | Fair 58.5% |
| Nigerians | 23.0 /100 | #201 | Fair 58.5% |
Demographics Similar to Immigrants from El Salvador by College, 1 year or more
In terms of college, 1 year or more, the demographic groups most similar to Immigrants from El Salvador are Kiowa (51.0%, a difference of 0.060%), Immigrants from Honduras (51.0%, a difference of 0.090%), Hopi (50.9%, a difference of 0.19%), Hispanic or Latino (51.1%, a difference of 0.22%), and Cajun (51.2%, a difference of 0.31%).
| Demographics | Rating | Rank | College, 1 year or more |
| Pueblo | 0.0 /100 | #312 | Tragic 51.5% |
| Immigrants | Caribbean | 0.0 /100 | #313 | Tragic 51.4% |
| Fijians | 0.0 /100 | #314 | Tragic 51.3% |
| Guatemalans | 0.0 /100 | #315 | Tragic 51.2% |
| Cajuns | 0.0 /100 | #316 | Tragic 51.2% |
| Hispanics or Latinos | 0.0 /100 | #317 | Tragic 51.1% |
| Immigrants | Honduras | 0.0 /100 | #318 | Tragic 51.0% |
| Immigrants | El Salvador | 0.0 /100 | #319 | Tragic 51.0% |
| Kiowa | 0.0 /100 | #320 | Tragic 51.0% |
| Hopi | 0.0 /100 | #321 | Tragic 50.9% |
| Navajo | 0.0 /100 | #322 | Tragic 50.8% |
| Immigrants | Guatemala | 0.0 /100 | #323 | Tragic 50.7% |
| Immigrants | Cuba | 0.0 /100 | #324 | Tragic 50.7% |
| Immigrants | Latin America | 0.0 /100 | #325 | Tragic 50.7% |
| Dominicans | 0.0 /100 | #326 | Tragic 50.6% |