Costa Rican vs Mexican College, 1 year or more
COMPARE
Costa Rican
Mexican
College, 1 year or more
College, 1 year or more Comparison
Costa Ricans
Mexicans
58.6%
COLLEGE, 1 YEAR OR MORE
26.4/ 100
METRIC RATING
194th/ 347
METRIC RANK
49.2%
COLLEGE, 1 YEAR OR MORE
0.0/ 100
METRIC RATING
332nd/ 347
METRIC RANK
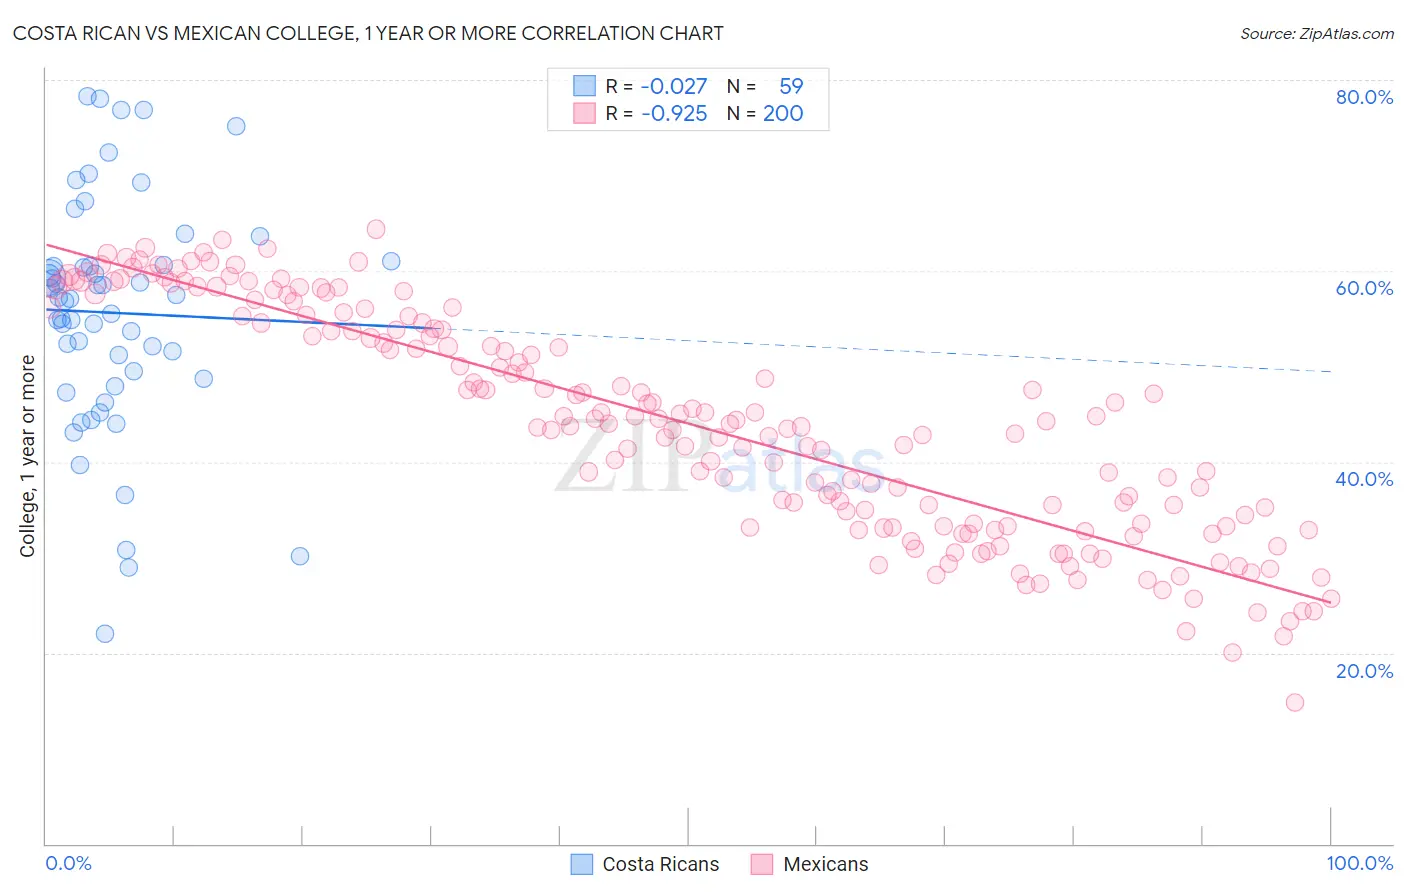
Costa Rican vs Mexican College, 1 year or more Correlation Chart
The statistical analysis conducted on geographies consisting of 253,601,897 people shows no correlation between the proportion of Costa Ricans and percentage of population with at least college, 1 year or more education in the United States with a correlation coefficient (R) of -0.027 and weighted average of 58.6%. Similarly, the statistical analysis conducted on geographies consisting of 565,315,068 people shows a near-perfect negative correlation between the proportion of Mexicans and percentage of population with at least college, 1 year or more education in the United States with a correlation coefficient (R) of -0.925 and weighted average of 49.2%, a difference of 19.1%.
College, 1 year or more Correlation Summary
| Measurement | Costa Rican | Mexican |
| Minimum | 22.0% | 14.7% |
| Maximum | 78.3% | 64.4% |
| Range | 56.3% | 49.6% |
| Mean | 55.6% | 44.0% |
| Median | 57.1% | 44.1% |
| Interquartile 25% (IQ1) | 48.6% | 33.3% |
| Interquartile 75% (IQ3) | 60.6% | 54.9% |
| Interquartile Range (IQR) | 12.0% | 21.6% |
| Standard Deviation (Sample) | 12.1% | 11.7% |
| Standard Deviation (Population) | 12.0% | 11.7% |
Similar Demographics by College, 1 year or more
Demographics Similar to Costa Ricans by College, 1 year or more
In terms of college, 1 year or more, the demographic groups most similar to Costa Ricans are Dutch (58.6%, a difference of 0.020%), Guamanian/Chamorro (58.6%, a difference of 0.020%), Immigrants from Thailand (58.6%, a difference of 0.030%), Peruvian (58.6%, a difference of 0.070%), and Colombian (58.7%, a difference of 0.080%).
| Demographics | Rating | Rank | College, 1 year or more |
| Germans | 34.7 /100 | #187 | Fair 58.9% |
| French | 34.4 /100 | #188 | Fair 58.9% |
| Uruguayans | 31.8 /100 | #189 | Fair 58.8% |
| Immigrants | Cameroon | 31.2 /100 | #190 | Fair 58.8% |
| Immigrants | Philippines | 29.2 /100 | #191 | Fair 58.7% |
| Colombians | 27.6 /100 | #192 | Fair 58.7% |
| Peruvians | 27.5 /100 | #193 | Fair 58.6% |
| Costa Ricans | 26.4 /100 | #194 | Fair 58.6% |
| Dutch | 26.2 /100 | #195 | Fair 58.6% |
| Guamanians/Chamorros | 26.2 /100 | #196 | Fair 58.6% |
| Immigrants | Thailand | 26.0 /100 | #197 | Fair 58.6% |
| Immigrants | South Eastern Asia | 25.1 /100 | #198 | Fair 58.5% |
| Slovaks | 24.6 /100 | #199 | Fair 58.5% |
| Spanish | 24.2 /100 | #200 | Fair 58.5% |
| Nigerians | 23.0 /100 | #201 | Fair 58.5% |
Demographics Similar to Mexicans by College, 1 year or more
In terms of college, 1 year or more, the demographic groups most similar to Mexicans are Immigrants from Dominican Republic (49.1%, a difference of 0.17%), Lumbee (48.9%, a difference of 0.75%), Yuman (48.7%, a difference of 1.0%), Spanish American Indian (48.5%, a difference of 1.5%), and Pennsylvania German (48.5%, a difference of 1.5%).
| Demographics | Rating | Rank | College, 1 year or more |
| Immigrants | Latin America | 0.0 /100 | #325 | Tragic 50.7% |
| Dominicans | 0.0 /100 | #326 | Tragic 50.6% |
| Menominee | 0.0 /100 | #327 | Tragic 50.6% |
| Dutch West Indians | 0.0 /100 | #328 | Tragic 50.5% |
| Cape Verdeans | 0.0 /100 | #329 | Tragic 50.3% |
| Natives/Alaskans | 0.0 /100 | #330 | Tragic 50.2% |
| Immigrants | Yemen | 0.0 /100 | #331 | Tragic 50.0% |
| Mexicans | 0.0 /100 | #332 | Tragic 49.2% |
| Immigrants | Dominican Republic | 0.0 /100 | #333 | Tragic 49.1% |
| Lumbee | 0.0 /100 | #334 | Tragic 48.9% |
| Yuman | 0.0 /100 | #335 | Tragic 48.7% |
| Spanish American Indians | 0.0 /100 | #336 | Tragic 48.5% |
| Pennsylvania Germans | 0.0 /100 | #337 | Tragic 48.5% |
| Immigrants | Central America | 0.0 /100 | #338 | Tragic 48.5% |
| Immigrants | Azores | 0.0 /100 | #339 | Tragic 48.4% |