Costa Rican vs Ghanaian College, 1 year or more
COMPARE
Costa Rican
Ghanaian
College, 1 year or more
College, 1 year or more Comparison
Costa Ricans
Ghanaians
58.6%
COLLEGE, 1 YEAR OR MORE
26.4/ 100
METRIC RATING
194th/ 347
METRIC RANK
58.4%
COLLEGE, 1 YEAR OR MORE
20.9/ 100
METRIC RATING
203rd/ 347
METRIC RANK
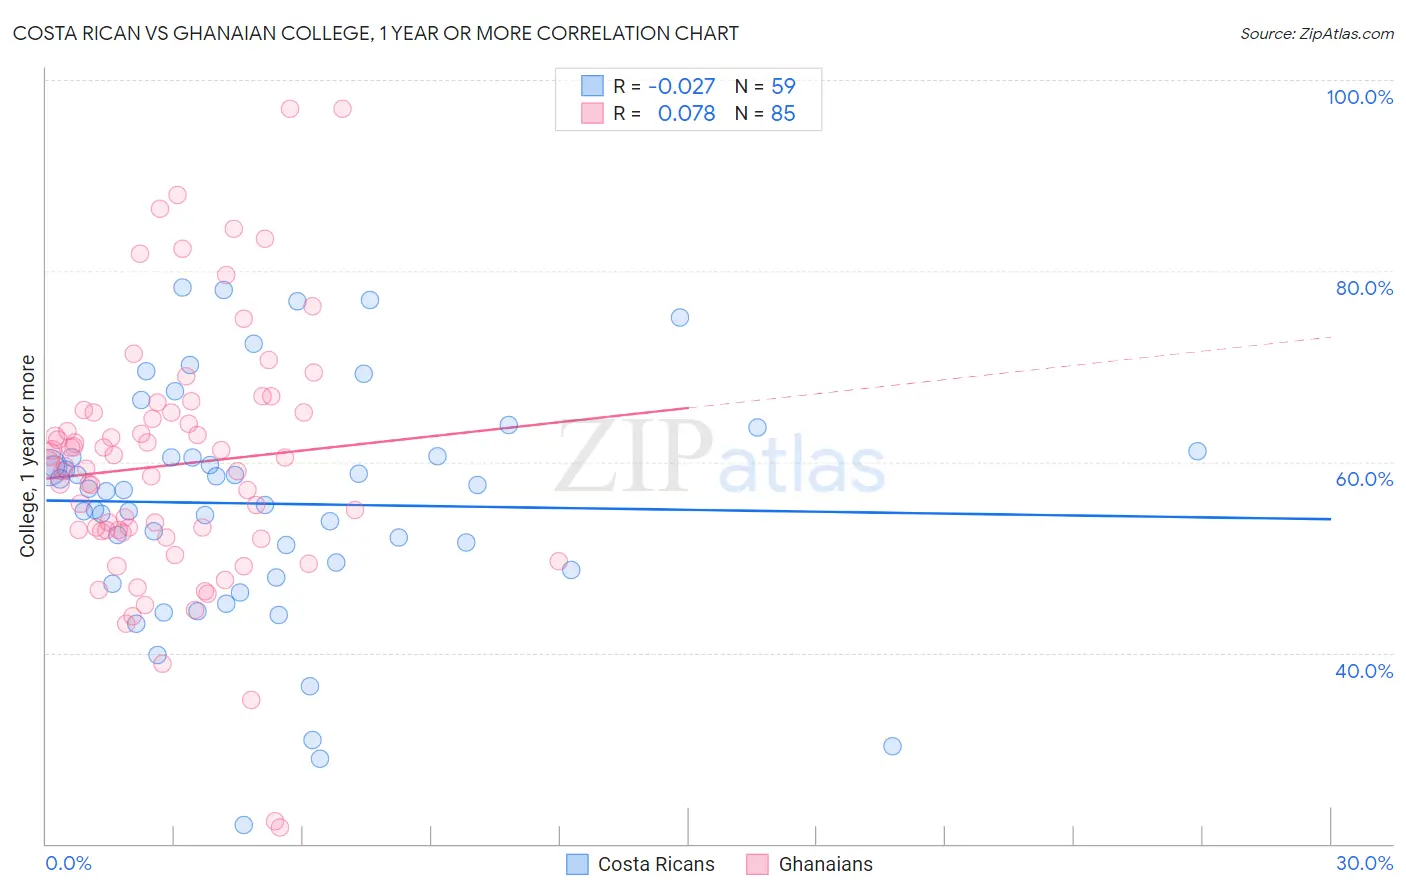
Costa Rican vs Ghanaian College, 1 year or more Correlation Chart
The statistical analysis conducted on geographies consisting of 253,601,897 people shows no correlation between the proportion of Costa Ricans and percentage of population with at least college, 1 year or more education in the United States with a correlation coefficient (R) of -0.027 and weighted average of 58.6%. Similarly, the statistical analysis conducted on geographies consisting of 190,712,650 people shows a slight positive correlation between the proportion of Ghanaians and percentage of population with at least college, 1 year or more education in the United States with a correlation coefficient (R) of 0.078 and weighted average of 58.4%, a difference of 0.42%.
College, 1 year or more Correlation Summary
| Measurement | Costa Rican | Ghanaian |
| Minimum | 22.0% | 21.7% |
| Maximum | 78.3% | 97.0% |
| Range | 56.3% | 75.4% |
| Mean | 55.6% | 59.7% |
| Median | 57.1% | 59.6% |
| Interquartile 25% (IQ1) | 48.6% | 52.7% |
| Interquartile 75% (IQ3) | 60.6% | 65.2% |
| Interquartile Range (IQR) | 12.0% | 12.5% |
| Standard Deviation (Sample) | 12.1% | 13.4% |
| Standard Deviation (Population) | 12.0% | 13.4% |
Demographics Similar to Costa Ricans and Ghanaians by College, 1 year or more
In terms of college, 1 year or more, the demographic groups most similar to Costa Ricans are Dutch (58.6%, a difference of 0.020%), Guamanian/Chamorro (58.6%, a difference of 0.020%), Immigrants from Thailand (58.6%, a difference of 0.030%), Peruvian (58.6%, a difference of 0.070%), and Colombian (58.7%, a difference of 0.080%). Similarly, the demographic groups most similar to Ghanaians are Immigrants from South America (58.4%, a difference of 0.090%), Panamanian (58.3%, a difference of 0.14%), Nigerian (58.5%, a difference of 0.17%), Immigrants from Zaire (58.3%, a difference of 0.19%), and Immigrants from Vietnam (58.2%, a difference of 0.23%).
| Demographics | Rating | Rank | College, 1 year or more |
| French | 34.4 /100 | #188 | Fair 58.9% |
| Uruguayans | 31.8 /100 | #189 | Fair 58.8% |
| Immigrants | Cameroon | 31.2 /100 | #190 | Fair 58.8% |
| Immigrants | Philippines | 29.2 /100 | #191 | Fair 58.7% |
| Colombians | 27.6 /100 | #192 | Fair 58.7% |
| Peruvians | 27.5 /100 | #193 | Fair 58.6% |
| Costa Ricans | 26.4 /100 | #194 | Fair 58.6% |
| Dutch | 26.2 /100 | #195 | Fair 58.6% |
| Guamanians/Chamorros | 26.2 /100 | #196 | Fair 58.6% |
| Immigrants | Thailand | 26.0 /100 | #197 | Fair 58.6% |
| Immigrants | South Eastern Asia | 25.1 /100 | #198 | Fair 58.5% |
| Slovaks | 24.6 /100 | #199 | Fair 58.5% |
| Spanish | 24.2 /100 | #200 | Fair 58.5% |
| Nigerians | 23.0 /100 | #201 | Fair 58.5% |
| Immigrants | South America | 21.9 /100 | #202 | Fair 58.4% |
| Ghanaians | 20.9 /100 | #203 | Fair 58.4% |
| Panamanians | 19.2 /100 | #204 | Poor 58.3% |
| Immigrants | Zaire | 18.7 /100 | #205 | Poor 58.3% |
| Immigrants | Vietnam | 18.2 /100 | #206 | Poor 58.2% |
| Senegalese | 16.9 /100 | #207 | Poor 58.2% |
| Immigrants | Uruguay | 15.2 /100 | #208 | Poor 58.1% |