Costa Rican vs Immigrants from Poland College, 1 year or more
COMPARE
Costa Rican
Immigrants from Poland
College, 1 year or more
College, 1 year or more Comparison
Costa Ricans
Immigrants from Poland
58.6%
COLLEGE, 1 YEAR OR MORE
26.4/ 100
METRIC RATING
194th/ 347
METRIC RANK
59.4%
COLLEGE, 1 YEAR OR MORE
48.9/ 100
METRIC RATING
176th/ 347
METRIC RANK
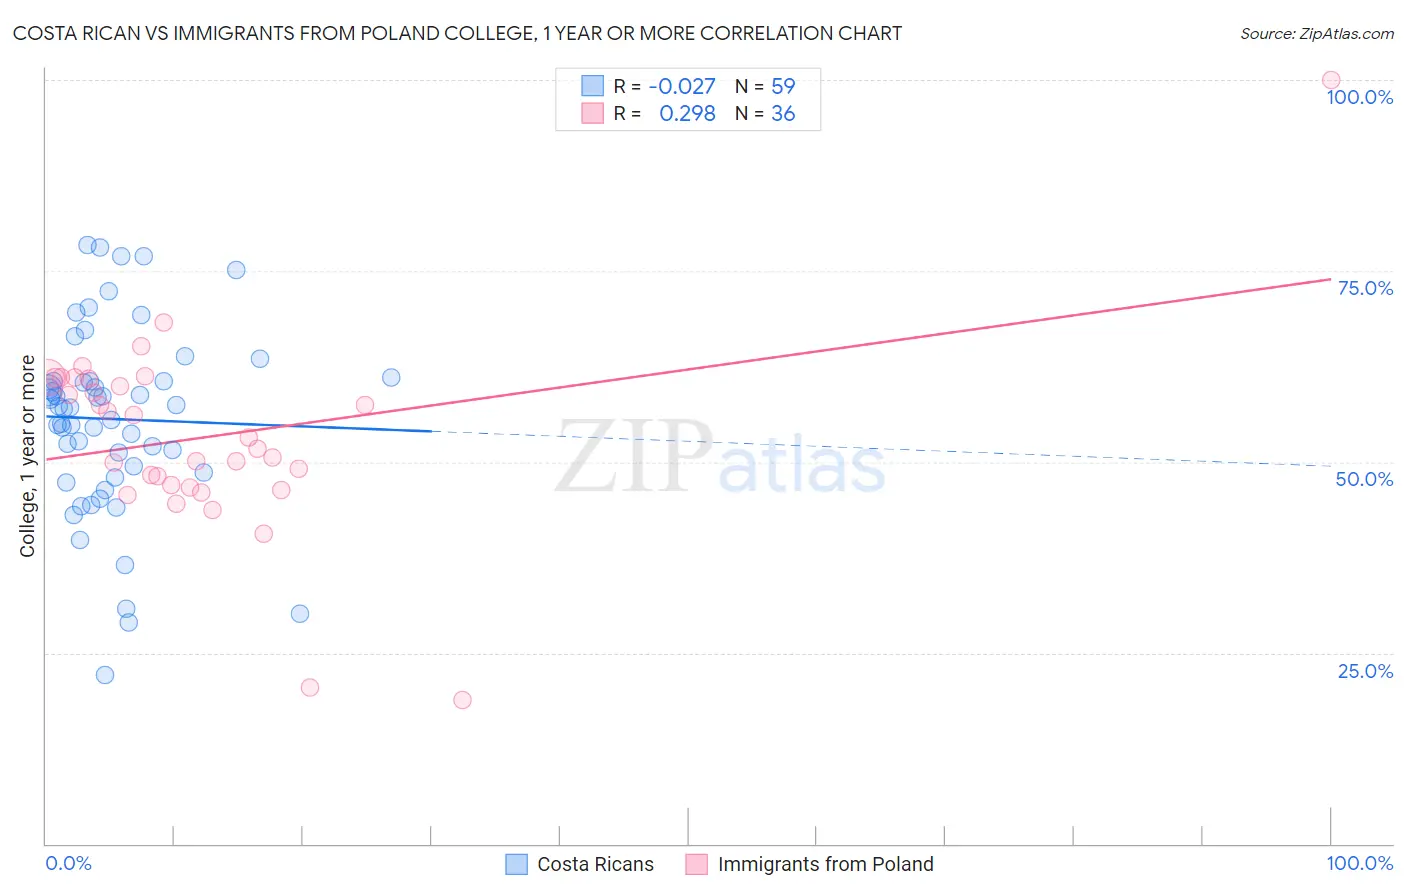
Costa Rican vs Immigrants from Poland College, 1 year or more Correlation Chart
The statistical analysis conducted on geographies consisting of 253,601,897 people shows no correlation between the proportion of Costa Ricans and percentage of population with at least college, 1 year or more education in the United States with a correlation coefficient (R) of -0.027 and weighted average of 58.6%. Similarly, the statistical analysis conducted on geographies consisting of 304,861,916 people shows a weak positive correlation between the proportion of Immigrants from Poland and percentage of population with at least college, 1 year or more education in the United States with a correlation coefficient (R) of 0.298 and weighted average of 59.4%, a difference of 1.3%.
College, 1 year or more Correlation Summary
| Measurement | Costa Rican | Immigrants from Poland |
| Minimum | 22.0% | 18.8% |
| Maximum | 78.3% | 100.0% |
| Range | 56.3% | 81.2% |
| Mean | 55.6% | 53.3% |
| Median | 57.1% | 52.5% |
| Interquartile 25% (IQ1) | 48.6% | 46.8% |
| Interquartile 75% (IQ3) | 60.6% | 60.9% |
| Interquartile Range (IQR) | 12.0% | 14.1% |
| Standard Deviation (Sample) | 12.1% | 13.2% |
| Standard Deviation (Population) | 12.0% | 13.0% |
Demographics Similar to Costa Ricans and Immigrants from Poland by College, 1 year or more
In terms of college, 1 year or more, the demographic groups most similar to Costa Ricans are Dutch (58.6%, a difference of 0.020%), Peruvian (58.6%, a difference of 0.070%), Colombian (58.7%, a difference of 0.080%), Immigrants from Philippines (58.7%, a difference of 0.18%), and Immigrants from Cameroon (58.8%, a difference of 0.31%). Similarly, the demographic groups most similar to Immigrants from Poland are Sri Lankan (59.4%, a difference of 0.010%), Tlingit-Haida (59.4%, a difference of 0.030%), Czechoslovakian (59.4%, a difference of 0.030%), Bermudan (59.3%, a difference of 0.12%), and Yugoslavian (59.2%, a difference of 0.26%).
| Demographics | Rating | Rank | College, 1 year or more |
| Sri Lankans | 49.0 /100 | #175 | Average 59.4% |
| Immigrants | Poland | 48.9 /100 | #176 | Average 59.4% |
| Tlingit-Haida | 48.4 /100 | #177 | Average 59.4% |
| Czechoslovakians | 48.3 /100 | #178 | Average 59.4% |
| Bermudans | 46.6 /100 | #179 | Average 59.3% |
| Yugoslavians | 44.1 /100 | #180 | Average 59.2% |
| Swiss | 43.4 /100 | #181 | Average 59.2% |
| Immigrants | Bosnia and Herzegovina | 42.8 /100 | #182 | Average 59.2% |
| German Russians | 39.3 /100 | #183 | Fair 59.1% |
| Spaniards | 38.3 /100 | #184 | Fair 59.0% |
| South Americans | 35.9 /100 | #185 | Fair 59.0% |
| Scotch-Irish | 34.7 /100 | #186 | Fair 58.9% |
| Germans | 34.7 /100 | #187 | Fair 58.9% |
| French | 34.4 /100 | #188 | Fair 58.9% |
| Uruguayans | 31.8 /100 | #189 | Fair 58.8% |
| Immigrants | Cameroon | 31.2 /100 | #190 | Fair 58.8% |
| Immigrants | Philippines | 29.2 /100 | #191 | Fair 58.7% |
| Colombians | 27.6 /100 | #192 | Fair 58.7% |
| Peruvians | 27.5 /100 | #193 | Fair 58.6% |
| Costa Ricans | 26.4 /100 | #194 | Fair 58.6% |
| Dutch | 26.2 /100 | #195 | Fair 58.6% |