Guatemalan vs Nonimmigrants College, 1 year or more
COMPARE
Guatemalan
Nonimmigrants
College, 1 year or more
College, 1 year or more Comparison
Guatemalans
Nonimmigrants
51.2%
COLLEGE, 1 YEAR OR MORE
0.0/ 100
METRIC RATING
315th/ 347
METRIC RANK
56.5%
COLLEGE, 1 YEAR OR MORE
2.5/ 100
METRIC RATING
233rd/ 347
METRIC RANK
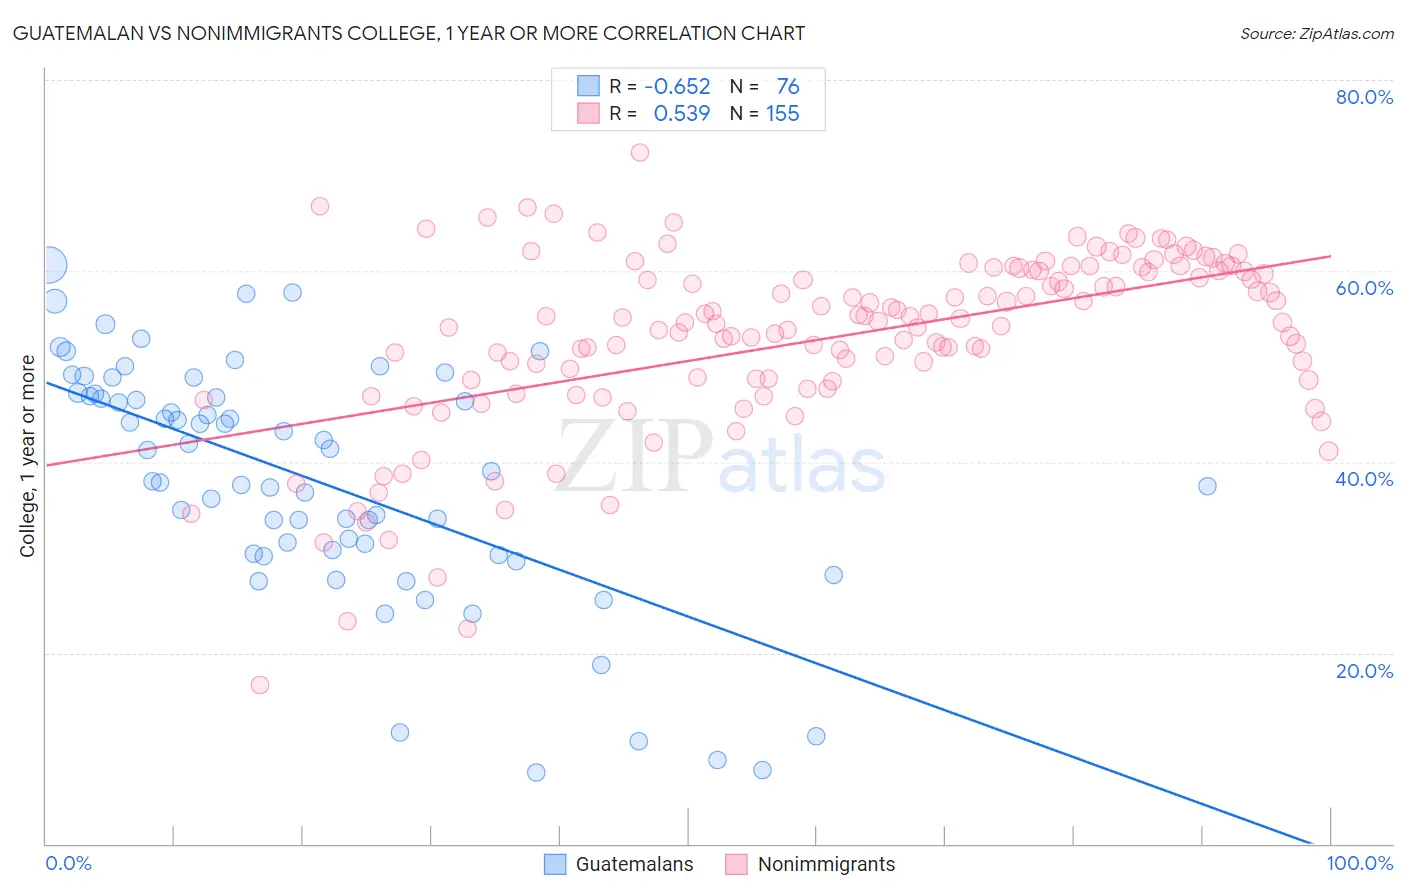
Guatemalan vs Nonimmigrants College, 1 year or more Correlation Chart
The statistical analysis conducted on geographies consisting of 409,563,742 people shows a significant negative correlation between the proportion of Guatemalans and percentage of population with at least college, 1 year or more education in the United States with a correlation coefficient (R) of -0.652 and weighted average of 51.2%. Similarly, the statistical analysis conducted on geographies consisting of 585,276,448 people shows a substantial positive correlation between the proportion of Nonimmigrants and percentage of population with at least college, 1 year or more education in the United States with a correlation coefficient (R) of 0.539 and weighted average of 56.5%, a difference of 10.4%.
College, 1 year or more Correlation Summary
| Measurement | Guatemalan | Nonimmigrants |
| Minimum | 7.4% | 16.7% |
| Maximum | 60.6% | 72.4% |
| Range | 53.2% | 55.7% |
| Mean | 38.2% | 52.9% |
| Median | 40.1% | 54.6% |
| Interquartile 25% (IQ1) | 30.6% | 48.5% |
| Interquartile 75% (IQ3) | 47.0% | 60.0% |
| Interquartile Range (IQR) | 16.5% | 11.5% |
| Standard Deviation (Sample) | 12.5% | 9.4% |
| Standard Deviation (Population) | 12.4% | 9.4% |
Similar Demographics by College, 1 year or more
Demographics Similar to Guatemalans by College, 1 year or more
In terms of college, 1 year or more, the demographic groups most similar to Guatemalans are Cajun (51.2%, a difference of 0.070%), Hispanic or Latino (51.1%, a difference of 0.16%), Fijian (51.3%, a difference of 0.23%), Immigrants from Honduras (51.0%, a difference of 0.29%), and Immigrants from El Salvador (51.0%, a difference of 0.38%).
| Demographics | Rating | Rank | College, 1 year or more |
| Salvadorans | 0.0 /100 | #308 | Tragic 51.8% |
| Apache | 0.0 /100 | #309 | Tragic 51.8% |
| Hondurans | 0.0 /100 | #310 | Tragic 51.6% |
| Immigrants | Haiti | 0.0 /100 | #311 | Tragic 51.5% |
| Pueblo | 0.0 /100 | #312 | Tragic 51.5% |
| Immigrants | Caribbean | 0.0 /100 | #313 | Tragic 51.4% |
| Fijians | 0.0 /100 | #314 | Tragic 51.3% |
| Guatemalans | 0.0 /100 | #315 | Tragic 51.2% |
| Cajuns | 0.0 /100 | #316 | Tragic 51.2% |
| Hispanics or Latinos | 0.0 /100 | #317 | Tragic 51.1% |
| Immigrants | Honduras | 0.0 /100 | #318 | Tragic 51.0% |
| Immigrants | El Salvador | 0.0 /100 | #319 | Tragic 51.0% |
| Kiowa | 0.0 /100 | #320 | Tragic 51.0% |
| Hopi | 0.0 /100 | #321 | Tragic 50.9% |
| Navajo | 0.0 /100 | #322 | Tragic 50.8% |
Demographics Similar to Nonimmigrants by College, 1 year or more
In terms of college, 1 year or more, the demographic groups most similar to Nonimmigrants are Immigrants from Bangladesh (56.6%, a difference of 0.090%), Immigrants from Burma/Myanmar (56.6%, a difference of 0.15%), Liberian (56.7%, a difference of 0.34%), Spanish American (56.3%, a difference of 0.45%), and West Indian (56.3%, a difference of 0.45%).
| Demographics | Rating | Rank | College, 1 year or more |
| Immigrants | Western Africa | 4.6 /100 | #226 | Tragic 57.0% |
| Immigrants | Immigrants | 4.4 /100 | #227 | Tragic 57.0% |
| Immigrants | Fiji | 4.0 /100 | #228 | Tragic 56.9% |
| Cree | 3.6 /100 | #229 | Tragic 56.8% |
| Liberians | 3.1 /100 | #230 | Tragic 56.7% |
| Immigrants | Burma/Myanmar | 2.7 /100 | #231 | Tragic 56.6% |
| Immigrants | Bangladesh | 2.6 /100 | #232 | Tragic 56.6% |
| Immigrants | Nonimmigrants | 2.5 /100 | #233 | Tragic 56.5% |
| Spanish Americans | 1.8 /100 | #234 | Tragic 56.3% |
| West Indians | 1.8 /100 | #235 | Tragic 56.3% |
| Iroquois | 1.7 /100 | #236 | Tragic 56.2% |
| Samoans | 1.6 /100 | #237 | Tragic 56.2% |
| Barbadians | 1.3 /100 | #238 | Tragic 56.0% |
| Puget Sound Salish | 1.1 /100 | #239 | Tragic 55.9% |
| Trinidadians and Tobagonians | 1.1 /100 | #240 | Tragic 55.8% |