Belgian vs Nonimmigrants College, 1 year or more
COMPARE
Belgian
Nonimmigrants
College, 1 year or more
College, 1 year or more Comparison
Belgians
Nonimmigrants
59.7%
COLLEGE, 1 YEAR OR MORE
58.1/ 100
METRIC RATING
164th/ 347
METRIC RANK
56.5%
COLLEGE, 1 YEAR OR MORE
2.5/ 100
METRIC RATING
233rd/ 347
METRIC RANK
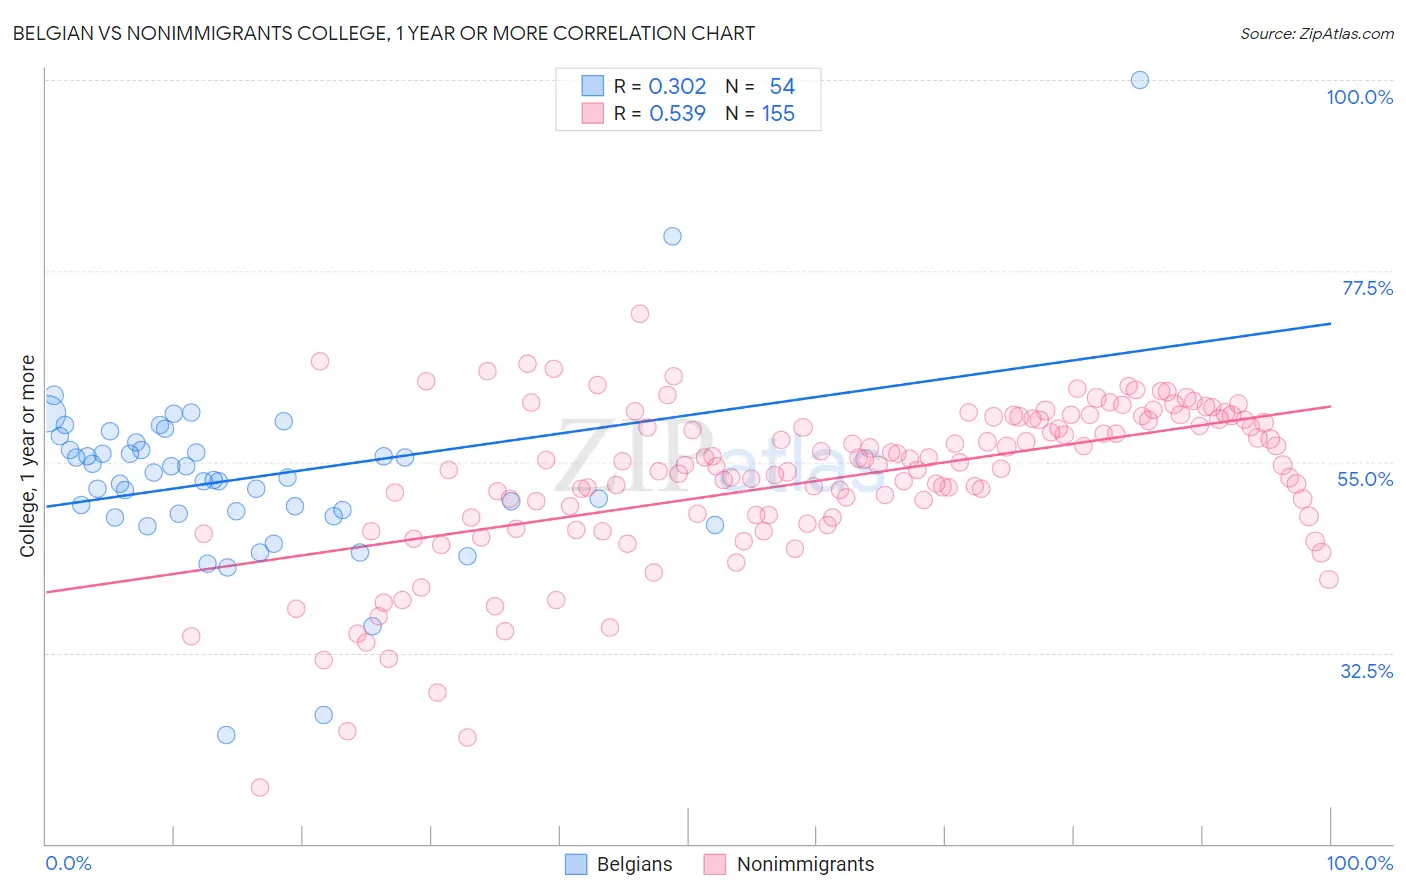
Belgian vs Nonimmigrants College, 1 year or more Correlation Chart
The statistical analysis conducted on geographies consisting of 356,017,497 people shows a mild positive correlation between the proportion of Belgians and percentage of population with at least college, 1 year or more education in the United States with a correlation coefficient (R) of 0.302 and weighted average of 59.7%. Similarly, the statistical analysis conducted on geographies consisting of 585,276,448 people shows a substantial positive correlation between the proportion of Nonimmigrants and percentage of population with at least college, 1 year or more education in the United States with a correlation coefficient (R) of 0.539 and weighted average of 56.5%, a difference of 5.6%.
College, 1 year or more Correlation Summary
| Measurement | Belgian | Nonimmigrants |
| Minimum | 22.8% | 16.7% |
| Maximum | 100.0% | 72.4% |
| Range | 77.2% | 55.7% |
| Mean | 53.1% | 52.9% |
| Median | 53.0% | 54.6% |
| Interquartile 25% (IQ1) | 48.9% | 48.5% |
| Interquartile 75% (IQ3) | 56.4% | 60.0% |
| Interquartile Range (IQR) | 7.6% | 11.5% |
| Standard Deviation (Sample) | 10.9% | 9.4% |
| Standard Deviation (Population) | 10.8% | 9.4% |
Similar Demographics by College, 1 year or more
Demographics Similar to Belgians by College, 1 year or more
In terms of college, 1 year or more, the demographic groups most similar to Belgians are Immigrants from Somalia (59.7%, a difference of 0.010%), Korean (59.7%, a difference of 0.020%), Irish (59.6%, a difference of 0.11%), Immigrants from Africa (59.6%, a difference of 0.11%), and Immigrants from North Macedonia (59.5%, a difference of 0.27%).
| Demographics | Rating | Rank | College, 1 year or more |
| Immigrants | Armenia | 68.8 /100 | #157 | Good 60.0% |
| English | 67.2 /100 | #158 | Good 60.0% |
| Immigrants | Iraq | 67.0 /100 | #159 | Good 60.0% |
| South American Indians | 66.9 /100 | #160 | Good 60.0% |
| Somalis | 64.5 /100 | #161 | Good 59.9% |
| Koreans | 58.5 /100 | #162 | Average 59.7% |
| Immigrants | Somalia | 58.3 /100 | #163 | Average 59.7% |
| Belgians | 58.1 /100 | #164 | Average 59.7% |
| Irish | 56.1 /100 | #165 | Average 59.6% |
| Immigrants | Africa | 56.1 /100 | #166 | Average 59.6% |
| Immigrants | North Macedonia | 53.1 /100 | #167 | Average 59.5% |
| Hungarians | 52.9 /100 | #168 | Average 59.5% |
| Immigrants | Southern Europe | 52.7 /100 | #169 | Average 59.5% |
| Welsh | 52.4 /100 | #170 | Average 59.5% |
| Immigrants | Albania | 52.3 /100 | #171 | Average 59.5% |
Demographics Similar to Nonimmigrants by College, 1 year or more
In terms of college, 1 year or more, the demographic groups most similar to Nonimmigrants are Immigrants from Bangladesh (56.6%, a difference of 0.090%), Immigrants from Burma/Myanmar (56.6%, a difference of 0.15%), Liberian (56.7%, a difference of 0.34%), Spanish American (56.3%, a difference of 0.45%), and West Indian (56.3%, a difference of 0.45%).
| Demographics | Rating | Rank | College, 1 year or more |
| Immigrants | Western Africa | 4.6 /100 | #226 | Tragic 57.0% |
| Immigrants | Immigrants | 4.4 /100 | #227 | Tragic 57.0% |
| Immigrants | Fiji | 4.0 /100 | #228 | Tragic 56.9% |
| Cree | 3.6 /100 | #229 | Tragic 56.8% |
| Liberians | 3.1 /100 | #230 | Tragic 56.7% |
| Immigrants | Burma/Myanmar | 2.7 /100 | #231 | Tragic 56.6% |
| Immigrants | Bangladesh | 2.6 /100 | #232 | Tragic 56.6% |
| Immigrants | Nonimmigrants | 2.5 /100 | #233 | Tragic 56.5% |
| Spanish Americans | 1.8 /100 | #234 | Tragic 56.3% |
| West Indians | 1.8 /100 | #235 | Tragic 56.3% |
| Iroquois | 1.7 /100 | #236 | Tragic 56.2% |
| Samoans | 1.6 /100 | #237 | Tragic 56.2% |
| Barbadians | 1.3 /100 | #238 | Tragic 56.0% |
| Puget Sound Salish | 1.1 /100 | #239 | Tragic 55.9% |
| Trinidadians and Tobagonians | 1.1 /100 | #240 | Tragic 55.8% |