Haitian vs Nonimmigrants College, 1 year or more
COMPARE
Haitian
Nonimmigrants
College, 1 year or more
College, 1 year or more Comparison
Haitians
Nonimmigrants
52.3%
COLLEGE, 1 YEAR OR MORE
0.0/ 100
METRIC RATING
301st/ 347
METRIC RANK
56.5%
COLLEGE, 1 YEAR OR MORE
2.5/ 100
METRIC RATING
233rd/ 347
METRIC RANK
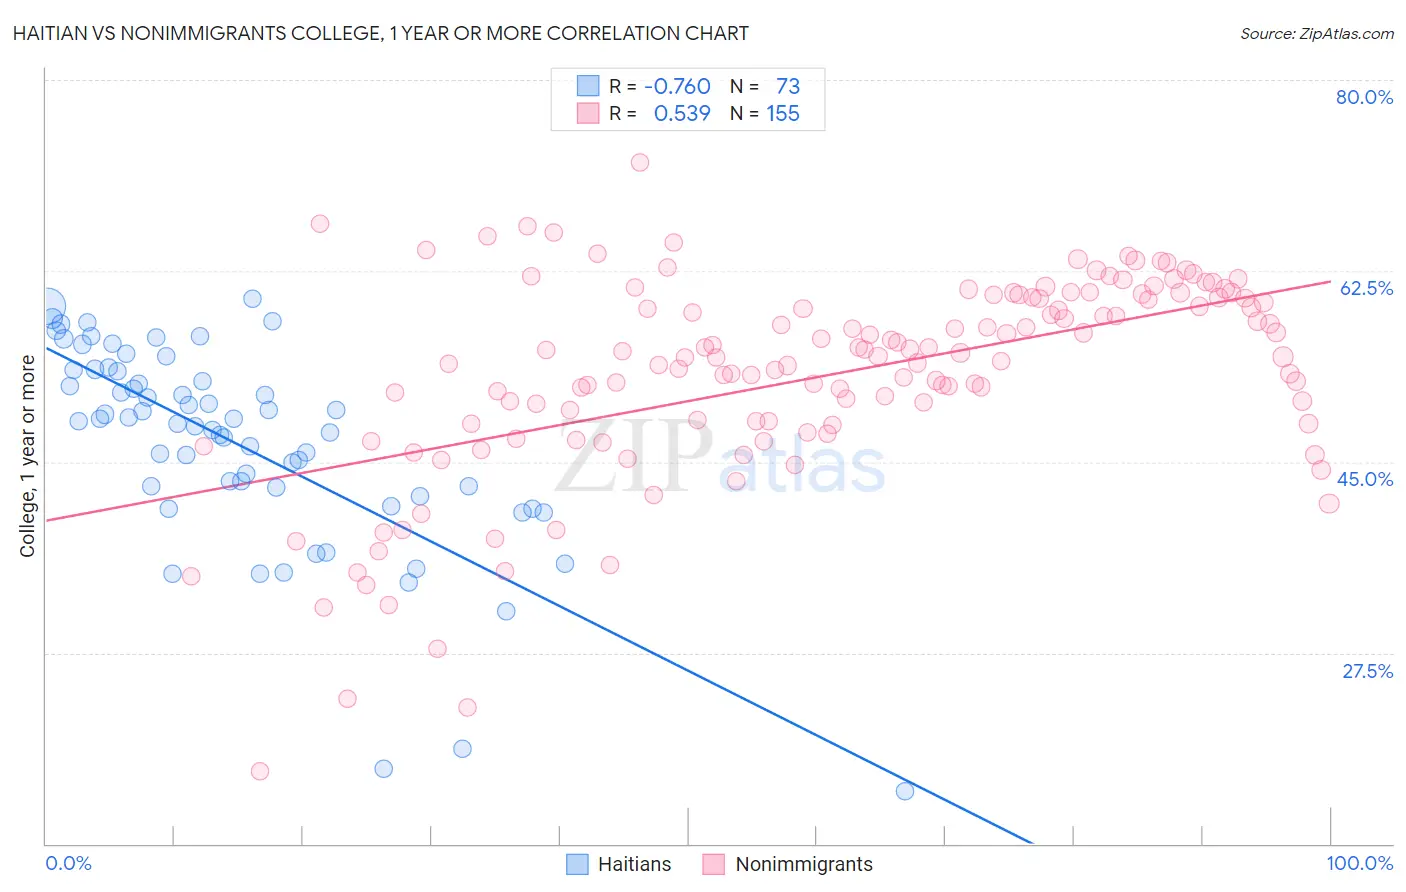
Haitian vs Nonimmigrants College, 1 year or more Correlation Chart
The statistical analysis conducted on geographies consisting of 288,015,465 people shows a strong negative correlation between the proportion of Haitians and percentage of population with at least college, 1 year or more education in the United States with a correlation coefficient (R) of -0.760 and weighted average of 52.3%. Similarly, the statistical analysis conducted on geographies consisting of 585,276,448 people shows a substantial positive correlation between the proportion of Nonimmigrants and percentage of population with at least college, 1 year or more education in the United States with a correlation coefficient (R) of 0.539 and weighted average of 56.5%, a difference of 8.0%.
College, 1 year or more Correlation Summary
| Measurement | Haitian | Nonimmigrants |
| Minimum | 14.8% | 16.7% |
| Maximum | 59.9% | 72.4% |
| Range | 45.1% | 55.7% |
| Mean | 46.6% | 52.9% |
| Median | 48.7% | 54.6% |
| Interquartile 25% (IQ1) | 42.3% | 48.5% |
| Interquartile 75% (IQ3) | 53.4% | 60.0% |
| Interquartile Range (IQR) | 11.1% | 11.5% |
| Standard Deviation (Sample) | 9.4% | 9.4% |
| Standard Deviation (Population) | 9.3% | 9.4% |
Similar Demographics by College, 1 year or more
Demographics Similar to Haitians by College, 1 year or more
In terms of college, 1 year or more, the demographic groups most similar to Haitians are Choctaw (52.3%, a difference of 0.060%), Immigrants from Nicaragua (52.4%, a difference of 0.10%), Puerto Rican (52.2%, a difference of 0.13%), Creek (52.2%, a difference of 0.21%), and Central American (52.1%, a difference of 0.34%).
| Demographics | Rating | Rank | College, 1 year or more |
| Cherokee | 0.0 /100 | #294 | Tragic 53.2% |
| Yaqui | 0.0 /100 | #295 | Tragic 53.2% |
| Sioux | 0.0 /100 | #296 | Tragic 53.0% |
| Paiute | 0.0 /100 | #297 | Tragic 52.9% |
| Immigrants | Dominica | 0.0 /100 | #298 | Tragic 52.5% |
| Immigrants | Nicaragua | 0.0 /100 | #299 | Tragic 52.4% |
| Choctaw | 0.0 /100 | #300 | Tragic 52.3% |
| Haitians | 0.0 /100 | #301 | Tragic 52.3% |
| Puerto Ricans | 0.0 /100 | #302 | Tragic 52.2% |
| Creek | 0.0 /100 | #303 | Tragic 52.2% |
| Central Americans | 0.0 /100 | #304 | Tragic 52.1% |
| Seminole | 0.0 /100 | #305 | Tragic 52.1% |
| Mexican American Indians | 0.0 /100 | #306 | Tragic 51.9% |
| Immigrants | Portugal | 0.0 /100 | #307 | Tragic 51.9% |
| Salvadorans | 0.0 /100 | #308 | Tragic 51.8% |
Demographics Similar to Nonimmigrants by College, 1 year or more
In terms of college, 1 year or more, the demographic groups most similar to Nonimmigrants are Immigrants from Bangladesh (56.6%, a difference of 0.090%), Immigrants from Burma/Myanmar (56.6%, a difference of 0.15%), Liberian (56.7%, a difference of 0.34%), Spanish American (56.3%, a difference of 0.45%), and West Indian (56.3%, a difference of 0.45%).
| Demographics | Rating | Rank | College, 1 year or more |
| Immigrants | Western Africa | 4.6 /100 | #226 | Tragic 57.0% |
| Immigrants | Immigrants | 4.4 /100 | #227 | Tragic 57.0% |
| Immigrants | Fiji | 4.0 /100 | #228 | Tragic 56.9% |
| Cree | 3.6 /100 | #229 | Tragic 56.8% |
| Liberians | 3.1 /100 | #230 | Tragic 56.7% |
| Immigrants | Burma/Myanmar | 2.7 /100 | #231 | Tragic 56.6% |
| Immigrants | Bangladesh | 2.6 /100 | #232 | Tragic 56.6% |
| Immigrants | Nonimmigrants | 2.5 /100 | #233 | Tragic 56.5% |
| Spanish Americans | 1.8 /100 | #234 | Tragic 56.3% |
| West Indians | 1.8 /100 | #235 | Tragic 56.3% |
| Iroquois | 1.7 /100 | #236 | Tragic 56.2% |
| Samoans | 1.6 /100 | #237 | Tragic 56.2% |
| Barbadians | 1.3 /100 | #238 | Tragic 56.0% |
| Puget Sound Salish | 1.1 /100 | #239 | Tragic 55.9% |
| Trinidadians and Tobagonians | 1.1 /100 | #240 | Tragic 55.8% |