Immigrants from Nigeria vs Nonimmigrants College, 1 year or more
COMPARE
Immigrants from Nigeria
Nonimmigrants
College, 1 year or more
College, 1 year or more Comparison
Immigrants from Nigeria
Nonimmigrants
57.9%
COLLEGE, 1 YEAR OR MORE
13.3/ 100
METRIC RATING
211th/ 347
METRIC RANK
56.5%
COLLEGE, 1 YEAR OR MORE
2.5/ 100
METRIC RATING
233rd/ 347
METRIC RANK
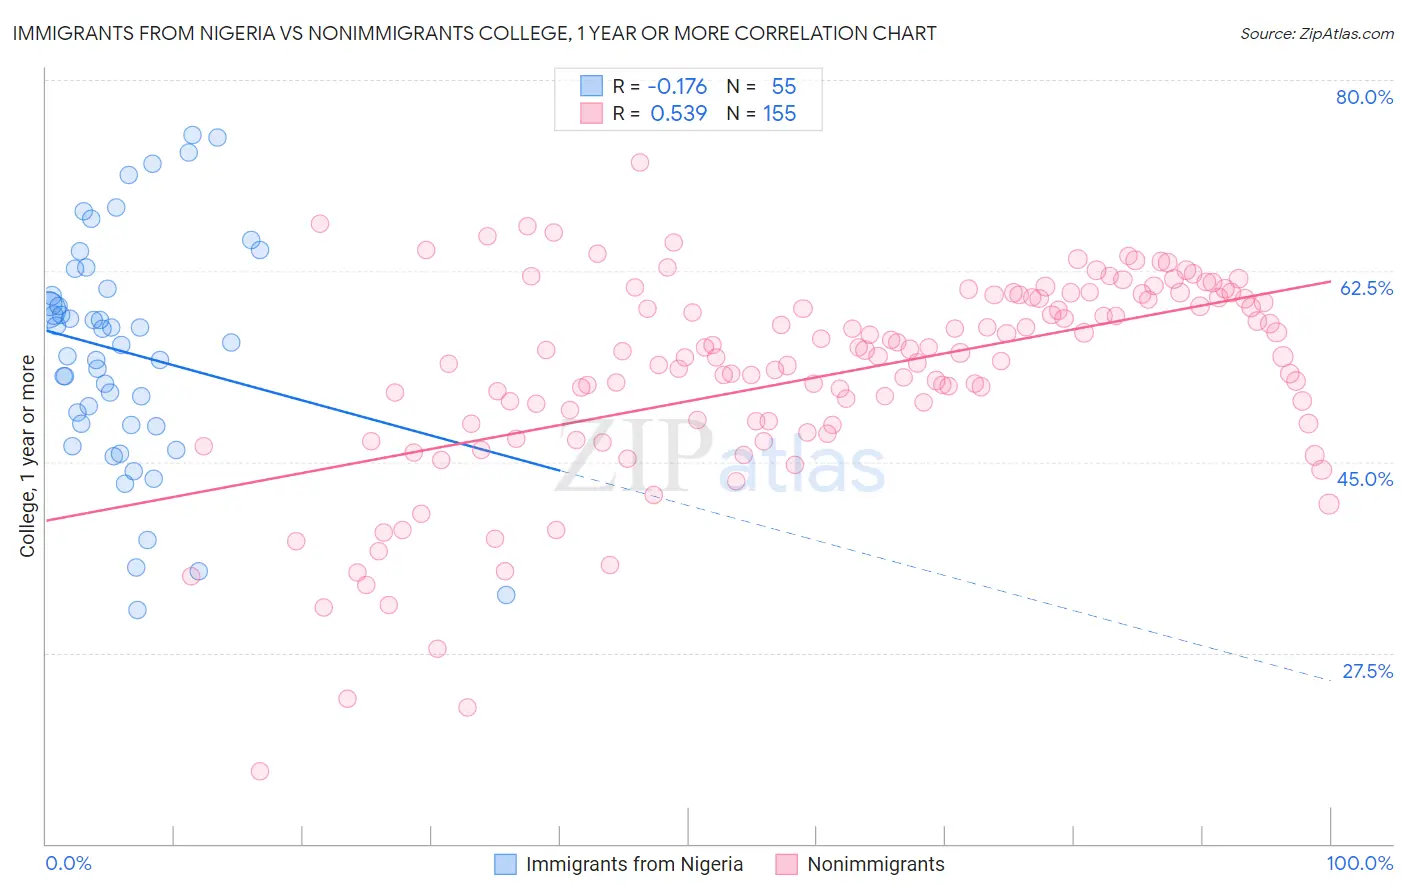
Immigrants from Nigeria vs Nonimmigrants College, 1 year or more Correlation Chart
The statistical analysis conducted on geographies consisting of 283,490,343 people shows a poor negative correlation between the proportion of Immigrants from Nigeria and percentage of population with at least college, 1 year or more education in the United States with a correlation coefficient (R) of -0.176 and weighted average of 57.9%. Similarly, the statistical analysis conducted on geographies consisting of 585,276,448 people shows a substantial positive correlation between the proportion of Nonimmigrants and percentage of population with at least college, 1 year or more education in the United States with a correlation coefficient (R) of 0.539 and weighted average of 56.5%, a difference of 2.5%.
College, 1 year or more Correlation Summary
| Measurement | Immigrants from Nigeria | Nonimmigrants |
| Minimum | 31.4% | 16.7% |
| Maximum | 75.0% | 72.4% |
| Range | 43.6% | 55.7% |
| Mean | 55.1% | 52.9% |
| Median | 55.9% | 54.6% |
| Interquartile 25% (IQ1) | 48.4% | 48.5% |
| Interquartile 75% (IQ3) | 60.9% | 60.0% |
| Interquartile Range (IQR) | 12.5% | 11.5% |
| Standard Deviation (Sample) | 10.4% | 9.4% |
| Standard Deviation (Population) | 10.3% | 9.4% |
Similar Demographics by College, 1 year or more
Demographics Similar to Immigrants from Nigeria by College, 1 year or more
In terms of college, 1 year or more, the demographic groups most similar to Immigrants from Nigeria are Tsimshian (57.9%, a difference of 0.020%), Immigrants from Middle Africa (58.0%, a difference of 0.080%), Immigrants from Senegal (57.8%, a difference of 0.18%), French Canadian (57.8%, a difference of 0.18%), and Immigrants from Colombia (57.8%, a difference of 0.21%).
| Demographics | Rating | Rank | College, 1 year or more |
| Panamanians | 19.2 /100 | #204 | Poor 58.3% |
| Immigrants | Zaire | 18.7 /100 | #205 | Poor 58.3% |
| Immigrants | Vietnam | 18.2 /100 | #206 | Poor 58.2% |
| Senegalese | 16.9 /100 | #207 | Poor 58.2% |
| Immigrants | Uruguay | 15.2 /100 | #208 | Poor 58.1% |
| Immigrants | Middle Africa | 14.0 /100 | #209 | Poor 58.0% |
| Tsimshian | 13.5 /100 | #210 | Poor 57.9% |
| Immigrants | Nigeria | 13.3 /100 | #211 | Poor 57.9% |
| Immigrants | Senegal | 11.8 /100 | #212 | Poor 57.8% |
| French Canadians | 11.8 /100 | #213 | Poor 57.8% |
| Immigrants | Colombia | 11.6 /100 | #214 | Poor 57.8% |
| Tongans | 11.6 /100 | #215 | Poor 57.8% |
| Immigrants | Peru | 10.6 /100 | #216 | Poor 57.7% |
| Immigrants | Panama | 9.1 /100 | #217 | Tragic 57.6% |
| Native Hawaiians | 9.0 /100 | #218 | Tragic 57.6% |
Demographics Similar to Nonimmigrants by College, 1 year or more
In terms of college, 1 year or more, the demographic groups most similar to Nonimmigrants are Immigrants from Bangladesh (56.6%, a difference of 0.090%), Immigrants from Burma/Myanmar (56.6%, a difference of 0.15%), Liberian (56.7%, a difference of 0.34%), Spanish American (56.3%, a difference of 0.45%), and West Indian (56.3%, a difference of 0.45%).
| Demographics | Rating | Rank | College, 1 year or more |
| Immigrants | Western Africa | 4.6 /100 | #226 | Tragic 57.0% |
| Immigrants | Immigrants | 4.4 /100 | #227 | Tragic 57.0% |
| Immigrants | Fiji | 4.0 /100 | #228 | Tragic 56.9% |
| Cree | 3.6 /100 | #229 | Tragic 56.8% |
| Liberians | 3.1 /100 | #230 | Tragic 56.7% |
| Immigrants | Burma/Myanmar | 2.7 /100 | #231 | Tragic 56.6% |
| Immigrants | Bangladesh | 2.6 /100 | #232 | Tragic 56.6% |
| Immigrants | Nonimmigrants | 2.5 /100 | #233 | Tragic 56.5% |
| Spanish Americans | 1.8 /100 | #234 | Tragic 56.3% |
| West Indians | 1.8 /100 | #235 | Tragic 56.3% |
| Iroquois | 1.7 /100 | #236 | Tragic 56.2% |
| Samoans | 1.6 /100 | #237 | Tragic 56.2% |
| Barbadians | 1.3 /100 | #238 | Tragic 56.0% |
| Puget Sound Salish | 1.1 /100 | #239 | Tragic 55.9% |
| Trinidadians and Tobagonians | 1.1 /100 | #240 | Tragic 55.8% |