Costa Rican vs Immigrants from Denmark College, 1 year or more
COMPARE
Costa Rican
Immigrants from Denmark
College, 1 year or more
College, 1 year or more Comparison
Costa Ricans
Immigrants from Denmark
58.6%
COLLEGE, 1 YEAR OR MORE
26.4/ 100
METRIC RATING
194th/ 347
METRIC RANK
65.6%
COLLEGE, 1 YEAR OR MORE
100.0/ 100
METRIC RATING
30th/ 347
METRIC RANK
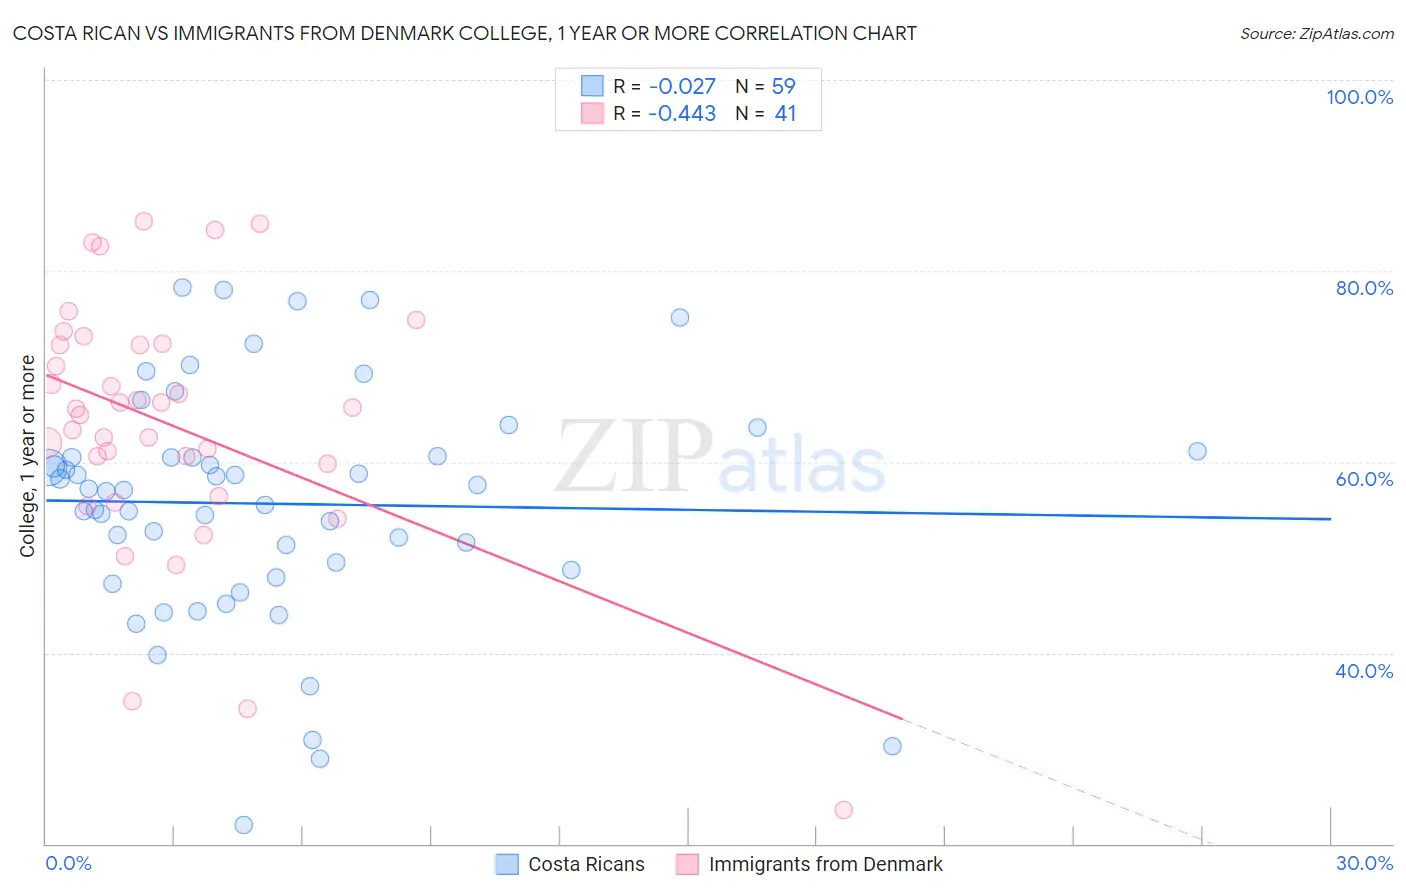
Costa Rican vs Immigrants from Denmark College, 1 year or more Correlation Chart
The statistical analysis conducted on geographies consisting of 253,601,897 people shows no correlation between the proportion of Costa Ricans and percentage of population with at least college, 1 year or more education in the United States with a correlation coefficient (R) of -0.027 and weighted average of 58.6%. Similarly, the statistical analysis conducted on geographies consisting of 136,430,932 people shows a moderate negative correlation between the proportion of Immigrants from Denmark and percentage of population with at least college, 1 year or more education in the United States with a correlation coefficient (R) of -0.443 and weighted average of 65.6%, a difference of 11.9%.
College, 1 year or more Correlation Summary
| Measurement | Costa Rican | Immigrants from Denmark |
| Minimum | 22.0% | 23.5% |
| Maximum | 78.3% | 85.2% |
| Range | 56.3% | 61.6% |
| Mean | 55.6% | 64.0% |
| Median | 57.1% | 65.5% |
| Interquartile 25% (IQ1) | 48.6% | 58.1% |
| Interquartile 75% (IQ3) | 60.6% | 72.3% |
| Interquartile Range (IQR) | 12.0% | 14.1% |
| Standard Deviation (Sample) | 12.1% | 13.3% |
| Standard Deviation (Population) | 12.0% | 13.1% |
Similar Demographics by College, 1 year or more
Demographics Similar to Costa Ricans by College, 1 year or more
In terms of college, 1 year or more, the demographic groups most similar to Costa Ricans are Dutch (58.6%, a difference of 0.020%), Guamanian/Chamorro (58.6%, a difference of 0.020%), Immigrants from Thailand (58.6%, a difference of 0.030%), Peruvian (58.6%, a difference of 0.070%), and Colombian (58.7%, a difference of 0.080%).
| Demographics | Rating | Rank | College, 1 year or more |
| Germans | 34.7 /100 | #187 | Fair 58.9% |
| French | 34.4 /100 | #188 | Fair 58.9% |
| Uruguayans | 31.8 /100 | #189 | Fair 58.8% |
| Immigrants | Cameroon | 31.2 /100 | #190 | Fair 58.8% |
| Immigrants | Philippines | 29.2 /100 | #191 | Fair 58.7% |
| Colombians | 27.6 /100 | #192 | Fair 58.7% |
| Peruvians | 27.5 /100 | #193 | Fair 58.6% |
| Costa Ricans | 26.4 /100 | #194 | Fair 58.6% |
| Dutch | 26.2 /100 | #195 | Fair 58.6% |
| Guamanians/Chamorros | 26.2 /100 | #196 | Fair 58.6% |
| Immigrants | Thailand | 26.0 /100 | #197 | Fair 58.6% |
| Immigrants | South Eastern Asia | 25.1 /100 | #198 | Fair 58.5% |
| Slovaks | 24.6 /100 | #199 | Fair 58.5% |
| Spanish | 24.2 /100 | #200 | Fair 58.5% |
| Nigerians | 23.0 /100 | #201 | Fair 58.5% |
Demographics Similar to Immigrants from Denmark by College, 1 year or more
In terms of college, 1 year or more, the demographic groups most similar to Immigrants from Denmark are Turkish (65.5%, a difference of 0.080%), Immigrants from Northern Europe (65.6%, a difference of 0.11%), Bulgarian (65.5%, a difference of 0.13%), Immigrants from Sri Lanka (65.4%, a difference of 0.28%), and Immigrants from France (65.8%, a difference of 0.36%).
| Demographics | Rating | Rank | College, 1 year or more |
| Immigrants | China | 100.0 /100 | #23 | Exceptional 66.4% |
| Immigrants | Belgium | 100.0 /100 | #24 | Exceptional 66.3% |
| Indians (Asian) | 100.0 /100 | #25 | Exceptional 66.1% |
| Latvians | 100.0 /100 | #26 | Exceptional 66.1% |
| Immigrants | Ireland | 100.0 /100 | #27 | Exceptional 65.9% |
| Immigrants | France | 100.0 /100 | #28 | Exceptional 65.8% |
| Immigrants | Northern Europe | 100.0 /100 | #29 | Exceptional 65.6% |
| Immigrants | Denmark | 100.0 /100 | #30 | Exceptional 65.6% |
| Turks | 100.0 /100 | #31 | Exceptional 65.5% |
| Bulgarians | 100.0 /100 | #32 | Exceptional 65.5% |
| Immigrants | Sri Lanka | 99.9 /100 | #33 | Exceptional 65.4% |
| Israelis | 99.9 /100 | #34 | Exceptional 65.3% |
| Immigrants | Turkey | 99.9 /100 | #35 | Exceptional 65.2% |
| Immigrants | South Africa | 99.9 /100 | #36 | Exceptional 65.1% |
| Russians | 99.9 /100 | #37 | Exceptional 65.1% |