Immigrants from Iran vs Nonimmigrants College, 1 year or more
COMPARE
Immigrants from Iran
Nonimmigrants
College, 1 year or more
College, 1 year or more Comparison
Immigrants from Iran
Nonimmigrants
69.5%
COLLEGE, 1 YEAR OR MORE
100.0/ 100
METRIC RATING
6th/ 347
METRIC RANK
56.5%
COLLEGE, 1 YEAR OR MORE
2.5/ 100
METRIC RATING
233rd/ 347
METRIC RANK
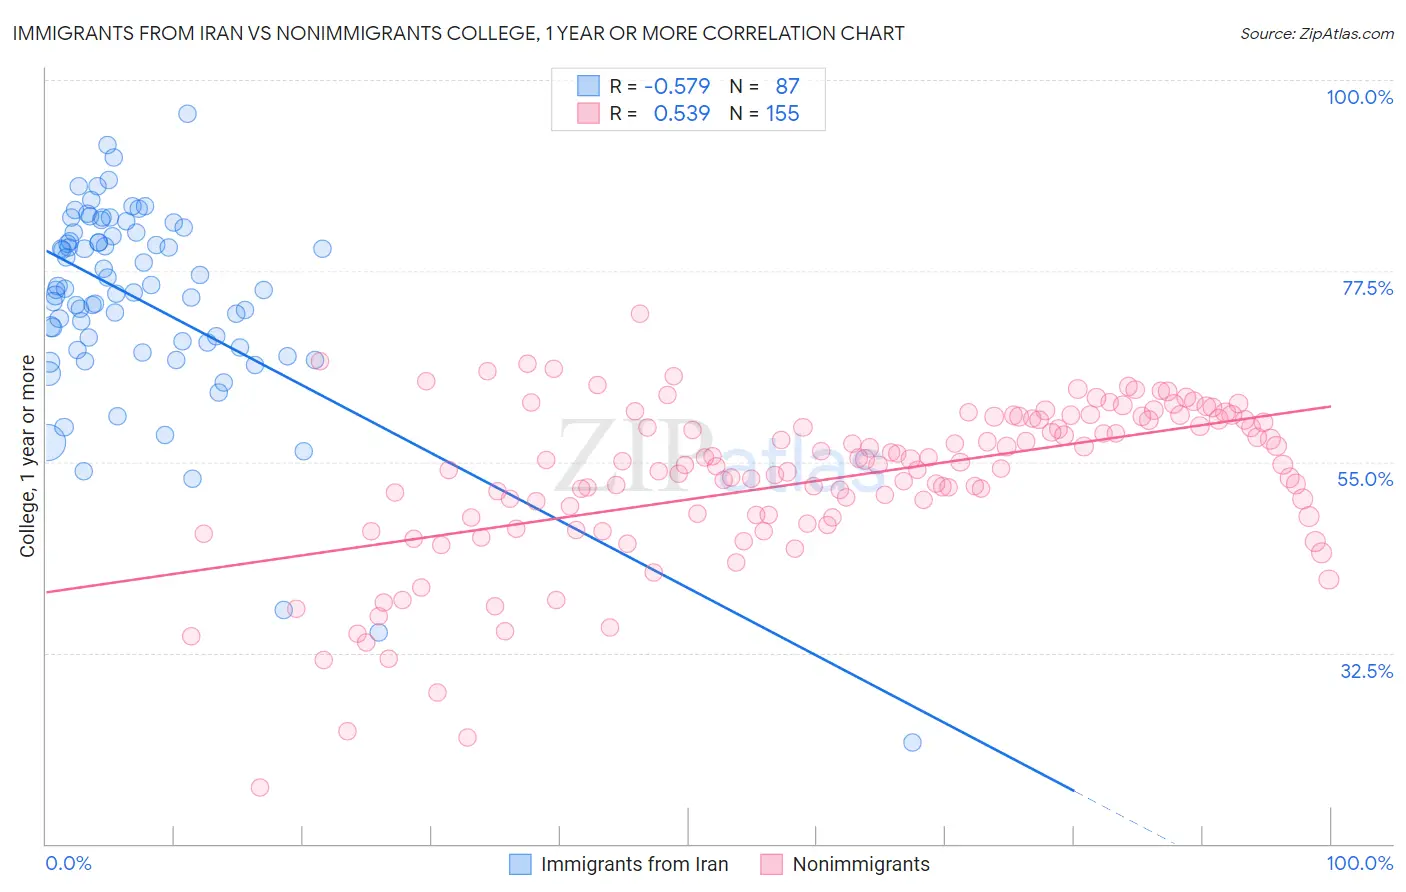
Immigrants from Iran vs Nonimmigrants College, 1 year or more Correlation Chart
The statistical analysis conducted on geographies consisting of 279,905,207 people shows a substantial negative correlation between the proportion of Immigrants from Iran and percentage of population with at least college, 1 year or more education in the United States with a correlation coefficient (R) of -0.579 and weighted average of 69.5%. Similarly, the statistical analysis conducted on geographies consisting of 585,276,448 people shows a substantial positive correlation between the proportion of Nonimmigrants and percentage of population with at least college, 1 year or more education in the United States with a correlation coefficient (R) of 0.539 and weighted average of 56.5%, a difference of 23.0%.
College, 1 year or more Correlation Summary
| Measurement | Immigrants from Iran | Nonimmigrants |
| Minimum | 22.0% | 16.7% |
| Maximum | 96.0% | 72.4% |
| Range | 74.0% | 55.7% |
| Mean | 74.0% | 52.9% |
| Median | 75.3% | 54.6% |
| Interquartile 25% (IQ1) | 68.5% | 48.5% |
| Interquartile 75% (IQ3) | 82.0% | 60.0% |
| Interquartile Range (IQR) | 13.4% | 11.5% |
| Standard Deviation (Sample) | 12.0% | 9.4% |
| Standard Deviation (Population) | 11.9% | 9.4% |
Similar Demographics by College, 1 year or more
Demographics Similar to Immigrants from Iran by College, 1 year or more
In terms of college, 1 year or more, the demographic groups most similar to Immigrants from Iran are Immigrants from Taiwan (69.6%, a difference of 0.20%), Immigrants from India (69.6%, a difference of 0.20%), Iranian (70.0%, a difference of 0.70%), Okinawan (69.0%, a difference of 0.77%), and Immigrants from Singapore (70.1%, a difference of 0.92%).
| Demographics | Rating | Rank | College, 1 year or more |
| Filipinos | 100.0 /100 | #1 | Exceptional 71.0% |
| Immigrants | Singapore | 100.0 /100 | #2 | Exceptional 70.1% |
| Iranians | 100.0 /100 | #3 | Exceptional 70.0% |
| Immigrants | Taiwan | 100.0 /100 | #4 | Exceptional 69.6% |
| Immigrants | India | 100.0 /100 | #5 | Exceptional 69.6% |
| Immigrants | Iran | 100.0 /100 | #6 | Exceptional 69.5% |
| Okinawans | 100.0 /100 | #7 | Exceptional 69.0% |
| Thais | 100.0 /100 | #8 | Exceptional 68.6% |
| Immigrants | Israel | 100.0 /100 | #9 | Exceptional 67.8% |
| Immigrants | Australia | 100.0 /100 | #10 | Exceptional 67.7% |
| Immigrants | South Central Asia | 100.0 /100 | #11 | Exceptional 67.1% |
| Cypriots | 100.0 /100 | #12 | Exceptional 67.0% |
| Immigrants | Sweden | 100.0 /100 | #13 | Exceptional 66.8% |
| Burmese | 100.0 /100 | #14 | Exceptional 66.7% |
| Cambodians | 100.0 /100 | #15 | Exceptional 66.7% |
Demographics Similar to Nonimmigrants by College, 1 year or more
In terms of college, 1 year or more, the demographic groups most similar to Nonimmigrants are Immigrants from Bangladesh (56.6%, a difference of 0.090%), Immigrants from Burma/Myanmar (56.6%, a difference of 0.15%), Liberian (56.7%, a difference of 0.34%), Spanish American (56.3%, a difference of 0.45%), and West Indian (56.3%, a difference of 0.45%).
| Demographics | Rating | Rank | College, 1 year or more |
| Immigrants | Western Africa | 4.6 /100 | #226 | Tragic 57.0% |
| Immigrants | Immigrants | 4.4 /100 | #227 | Tragic 57.0% |
| Immigrants | Fiji | 4.0 /100 | #228 | Tragic 56.9% |
| Cree | 3.6 /100 | #229 | Tragic 56.8% |
| Liberians | 3.1 /100 | #230 | Tragic 56.7% |
| Immigrants | Burma/Myanmar | 2.7 /100 | #231 | Tragic 56.6% |
| Immigrants | Bangladesh | 2.6 /100 | #232 | Tragic 56.6% |
| Immigrants | Nonimmigrants | 2.5 /100 | #233 | Tragic 56.5% |
| Spanish Americans | 1.8 /100 | #234 | Tragic 56.3% |
| West Indians | 1.8 /100 | #235 | Tragic 56.3% |
| Iroquois | 1.7 /100 | #236 | Tragic 56.2% |
| Samoans | 1.6 /100 | #237 | Tragic 56.2% |
| Barbadians | 1.3 /100 | #238 | Tragic 56.0% |
| Puget Sound Salish | 1.1 /100 | #239 | Tragic 55.9% |
| Trinidadians and Tobagonians | 1.1 /100 | #240 | Tragic 55.8% |