Austrian vs Latvian Associate's Degree
COMPARE
Austrian
Latvian
Associate's Degree
Associate's Degree Comparison
Austrians
Latvians
49.1%
ASSOCIATE'S DEGREE
95.8/ 100
METRIC RATING
110th/ 347
METRIC RANK
53.9%
ASSOCIATE'S DEGREE
100.0/ 100
METRIC RATING
27th/ 347
METRIC RANK
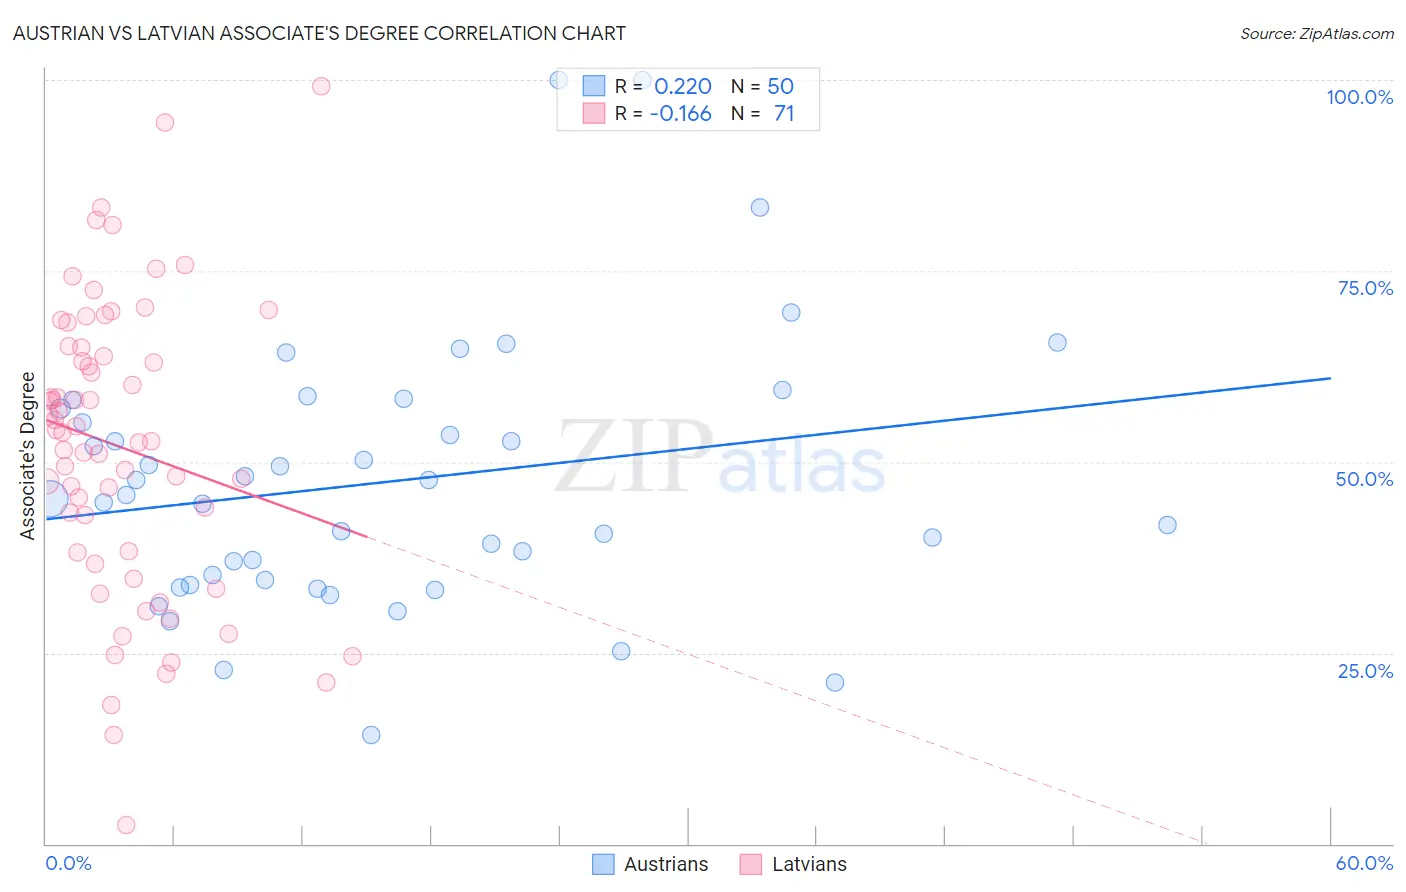
Austrian vs Latvian Associate's Degree Correlation Chart
The statistical analysis conducted on geographies consisting of 452,054,791 people shows a weak positive correlation between the proportion of Austrians and percentage of population with at least associate's degree education in the United States with a correlation coefficient (R) of 0.220 and weighted average of 49.1%. Similarly, the statistical analysis conducted on geographies consisting of 220,726,880 people shows a poor negative correlation between the proportion of Latvians and percentage of population with at least associate's degree education in the United States with a correlation coefficient (R) of -0.166 and weighted average of 53.9%, a difference of 9.9%.
Associate's Degree Correlation Summary
| Measurement | Austrian | Latvian |
| Minimum | 14.3% | 2.4% |
| Maximum | 100.0% | 99.2% |
| Range | 85.7% | 96.7% |
| Mean | 47.4% | 51.9% |
| Median | 45.5% | 53.9% |
| Interquartile 25% (IQ1) | 34.5% | 38.1% |
| Interquartile 75% (IQ3) | 57.0% | 64.9% |
| Interquartile Range (IQR) | 22.5% | 26.9% |
| Standard Deviation (Sample) | 17.5% | 19.2% |
| Standard Deviation (Population) | 17.3% | 19.1% |
Similar Demographics by Associate's Degree
Demographics Similar to Austrians by Associate's Degree
In terms of associate's degree, the demographic groups most similar to Austrians are Immigrants from Venezuela (49.1%, a difference of 0.030%), Immigrants from Morocco (49.2%, a difference of 0.22%), Immigrants from Chile (49.0%, a difference of 0.22%), Palestinian (49.0%, a difference of 0.22%), and Arab (49.0%, a difference of 0.22%).
| Demographics | Rating | Rank | Associate's Degree |
| Ukrainians | 97.1 /100 | #103 | Exceptional 49.4% |
| Venezuelans | 97.0 /100 | #104 | Exceptional 49.4% |
| Croatians | 96.8 /100 | #105 | Exceptional 49.3% |
| Immigrants | Italy | 96.7 /100 | #106 | Exceptional 49.3% |
| Syrians | 96.7 /100 | #107 | Exceptional 49.3% |
| Jordanians | 96.6 /100 | #108 | Exceptional 49.2% |
| Immigrants | Morocco | 96.3 /100 | #109 | Exceptional 49.2% |
| Austrians | 95.8 /100 | #110 | Exceptional 49.1% |
| Immigrants | Venezuela | 95.8 /100 | #111 | Exceptional 49.1% |
| Immigrants | Chile | 95.3 /100 | #112 | Exceptional 49.0% |
| Palestinians | 95.3 /100 | #113 | Exceptional 49.0% |
| Arabs | 95.3 /100 | #114 | Exceptional 49.0% |
| Luxembourgers | 95.1 /100 | #115 | Exceptional 48.9% |
| British | 95.0 /100 | #116 | Exceptional 48.9% |
| Afghans | 94.8 /100 | #117 | Exceptional 48.9% |
Demographics Similar to Latvians by Associate's Degree
In terms of associate's degree, the demographic groups most similar to Latvians are Turkish (53.9%, a difference of 0.070%), Immigrants from France (53.9%, a difference of 0.090%), Immigrants from Sri Lanka (53.7%, a difference of 0.50%), Immigrants from Northern Europe (53.5%, a difference of 0.87%), and Immigrants from Turkey (53.4%, a difference of 0.90%).
| Demographics | Rating | Rank | Associate's Degree |
| Cambodians | 100.0 /100 | #20 | Exceptional 54.6% |
| Immigrants | Sweden | 100.0 /100 | #21 | Exceptional 54.6% |
| Immigrants | Japan | 100.0 /100 | #22 | Exceptional 54.6% |
| Burmese | 100.0 /100 | #23 | Exceptional 54.6% |
| Immigrants | Korea | 100.0 /100 | #24 | Exceptional 54.5% |
| Immigrants | Switzerland | 100.0 /100 | #25 | Exceptional 54.5% |
| Immigrants | Belgium | 100.0 /100 | #26 | Exceptional 54.5% |
| Latvians | 100.0 /100 | #27 | Exceptional 53.9% |
| Turks | 100.0 /100 | #28 | Exceptional 53.9% |
| Immigrants | France | 100.0 /100 | #29 | Exceptional 53.9% |
| Immigrants | Sri Lanka | 100.0 /100 | #30 | Exceptional 53.7% |
| Immigrants | Northern Europe | 100.0 /100 | #31 | Exceptional 53.5% |
| Immigrants | Turkey | 100.0 /100 | #32 | Exceptional 53.4% |
| Israelis | 100.0 /100 | #33 | Exceptional 53.4% |
| Bulgarians | 100.0 /100 | #34 | Exceptional 53.3% |