Immigrants from Afghanistan vs Latvian Associate's Degree
COMPARE
Immigrants from Afghanistan
Latvian
Associate's Degree
Associate's Degree Comparison
Immigrants from Afghanistan
Latvians
47.3%
ASSOCIATE'S DEGREE
74.3/ 100
METRIC RATING
152nd/ 347
METRIC RANK
53.9%
ASSOCIATE'S DEGREE
100.0/ 100
METRIC RATING
27th/ 347
METRIC RANK
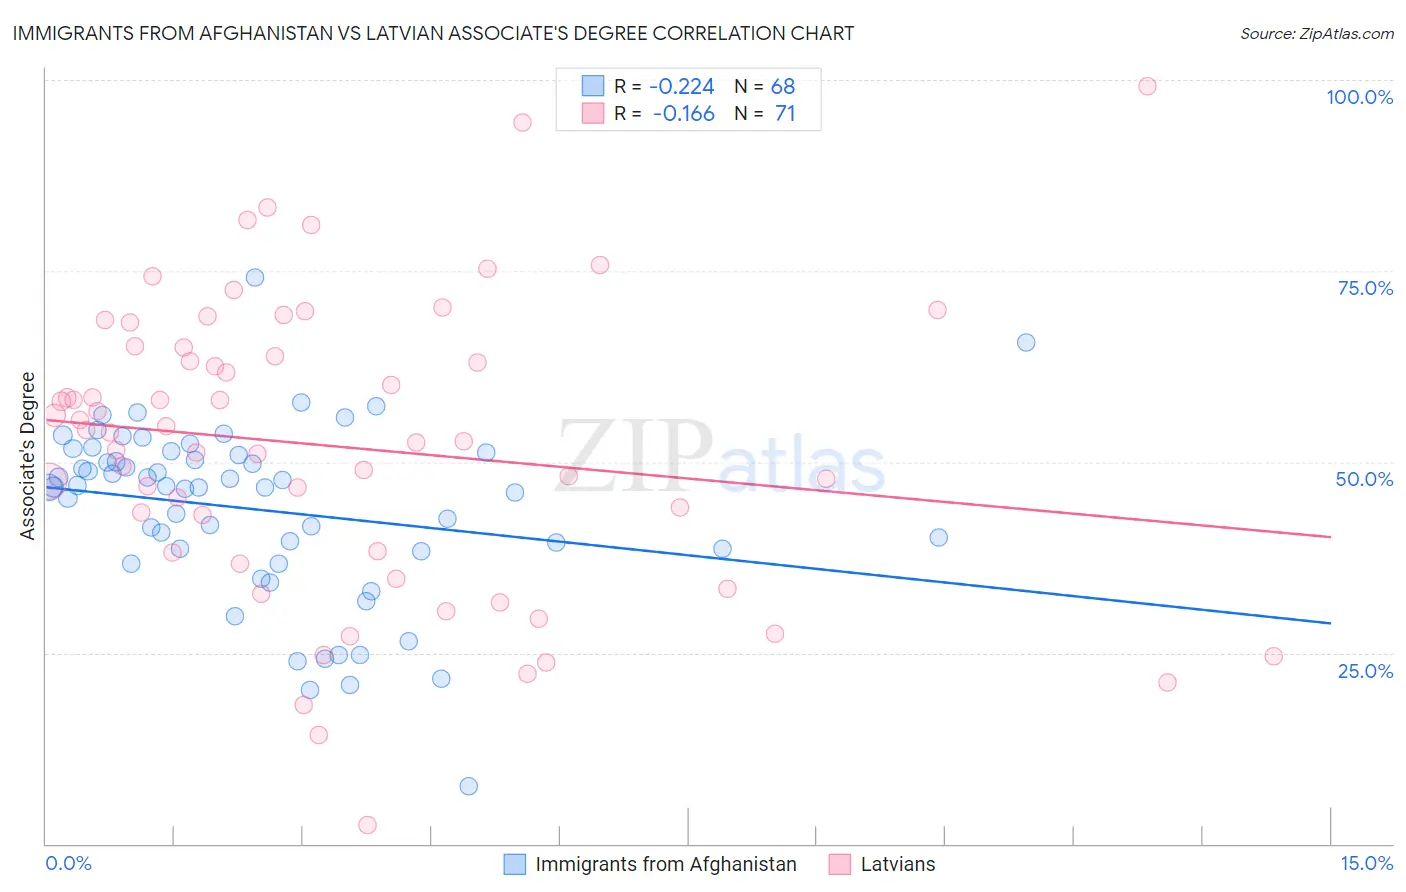
Immigrants from Afghanistan vs Latvian Associate's Degree Correlation Chart
The statistical analysis conducted on geographies consisting of 147,646,385 people shows a weak negative correlation between the proportion of Immigrants from Afghanistan and percentage of population with at least associate's degree education in the United States with a correlation coefficient (R) of -0.224 and weighted average of 47.3%. Similarly, the statistical analysis conducted on geographies consisting of 220,726,880 people shows a poor negative correlation between the proportion of Latvians and percentage of population with at least associate's degree education in the United States with a correlation coefficient (R) of -0.166 and weighted average of 53.9%, a difference of 14.1%.
Associate's Degree Correlation Summary
| Measurement | Immigrants from Afghanistan | Latvian |
| Minimum | 7.6% | 2.4% |
| Maximum | 74.2% | 99.2% |
| Range | 66.6% | 96.7% |
| Mean | 43.7% | 51.9% |
| Median | 46.7% | 53.9% |
| Interquartile 25% (IQ1) | 38.4% | 38.1% |
| Interquartile 75% (IQ3) | 51.1% | 64.9% |
| Interquartile Range (IQR) | 12.7% | 26.9% |
| Standard Deviation (Sample) | 11.6% | 19.2% |
| Standard Deviation (Population) | 11.5% | 19.1% |
Similar Demographics by Associate's Degree
Demographics Similar to Immigrants from Afghanistan by Associate's Degree
In terms of associate's degree, the demographic groups most similar to Immigrants from Afghanistan are Immigrants from North Macedonia (47.4%, a difference of 0.17%), Iraqi (47.4%, a difference of 0.19%), Czech (47.2%, a difference of 0.19%), Immigrants from Kenya (47.2%, a difference of 0.20%), and Immigrants from Armenia (47.4%, a difference of 0.23%).
| Demographics | Rating | Rank | Associate's Degree |
| Canadians | 79.0 /100 | #145 | Good 47.5% |
| Immigrants | Sudan | 77.9 /100 | #146 | Good 47.4% |
| Danes | 77.3 /100 | #147 | Good 47.4% |
| South American Indians | 76.7 /100 | #148 | Good 47.4% |
| Immigrants | Armenia | 76.6 /100 | #149 | Good 47.4% |
| Iraqis | 76.2 /100 | #150 | Good 47.4% |
| Immigrants | North Macedonia | 76.0 /100 | #151 | Good 47.4% |
| Immigrants | Afghanistan | 74.3 /100 | #152 | Good 47.3% |
| Czechs | 72.2 /100 | #153 | Good 47.2% |
| Immigrants | Kenya | 72.1 /100 | #154 | Good 47.2% |
| Kenyans | 70.6 /100 | #155 | Good 47.1% |
| South Americans | 70.5 /100 | #156 | Good 47.1% |
| Sudanese | 70.3 /100 | #157 | Good 47.1% |
| Immigrants | Germany | 69.7 /100 | #158 | Good 47.1% |
| Immigrants | Poland | 69.2 /100 | #159 | Good 47.1% |
Demographics Similar to Latvians by Associate's Degree
In terms of associate's degree, the demographic groups most similar to Latvians are Turkish (53.9%, a difference of 0.070%), Immigrants from France (53.9%, a difference of 0.090%), Immigrants from Sri Lanka (53.7%, a difference of 0.50%), Immigrants from Northern Europe (53.5%, a difference of 0.87%), and Immigrants from Turkey (53.4%, a difference of 0.90%).
| Demographics | Rating | Rank | Associate's Degree |
| Cambodians | 100.0 /100 | #20 | Exceptional 54.6% |
| Immigrants | Sweden | 100.0 /100 | #21 | Exceptional 54.6% |
| Immigrants | Japan | 100.0 /100 | #22 | Exceptional 54.6% |
| Burmese | 100.0 /100 | #23 | Exceptional 54.6% |
| Immigrants | Korea | 100.0 /100 | #24 | Exceptional 54.5% |
| Immigrants | Switzerland | 100.0 /100 | #25 | Exceptional 54.5% |
| Immigrants | Belgium | 100.0 /100 | #26 | Exceptional 54.5% |
| Latvians | 100.0 /100 | #27 | Exceptional 53.9% |
| Turks | 100.0 /100 | #28 | Exceptional 53.9% |
| Immigrants | France | 100.0 /100 | #29 | Exceptional 53.9% |
| Immigrants | Sri Lanka | 100.0 /100 | #30 | Exceptional 53.7% |
| Immigrants | Northern Europe | 100.0 /100 | #31 | Exceptional 53.5% |
| Immigrants | Turkey | 100.0 /100 | #32 | Exceptional 53.4% |
| Israelis | 100.0 /100 | #33 | Exceptional 53.4% |
| Bulgarians | 100.0 /100 | #34 | Exceptional 53.3% |