Austrian vs Immigrants from China Associate's Degree

COMPARE

Austrian
Race
Ancestry
AfghanAfricanAlaska NativeAlaskan AthabascanAlbanianAleutAlsatianAmericanApacheArabArapahoArgentineanArmenianAssyrian/Chaldean/SyriacAustralianAustrianBahamianBangladeshiBarbadianBasqueBelgianBelizeanBermudanBhutaneseBlackfeetBolivianBrazilianBritishBritish West IndianBulgarianBurmeseCajunCambodianCanadianCape VerdeanCarpatho RusynCelticCentral AmericanCentral American IndianCherokeeCheyenneChickasawChileanChineseChippewaChoctawColombianColvilleComancheCosta RicanCreeCreekCroatianCrowCubanCypriotCzechCzechoslovakianDanishDelawareDominicanDutchDutch West IndianEastern EuropeanEcuadorianEgyptianEnglishEstonianEthiopianEuropeanFijianFilipinoFinnishFrenchFrench American IndianFrench CanadianGermanGerman RussianGhanaianGreekGuamanian/ChamorroGuatemalanGuyaneseHaitianHmongHonduranHopiHoumaHungarianIcelanderIndian (Asian)IndonesianInupiatIranianIraqiIrishIroquoisIsraeliItalianJamaicanJapaneseJordanianKenyanKiowaKoreanLaotianLatvianLebaneseLiberianLithuanianLumbeeLuxembourgerMacedonianMalaysianMalteseMarshalleseMenomineeMexicanMexican American IndianMongolianMoroccanNative HawaiianNavajoNepaleseNew ZealanderNicaraguanNigerianNorthern EuropeanNorwegianOkinawanOsageOttawaPaiutePakistaniPalestinianPanamanianParaguayanPennsylvania GermanPeruvianPimaPolishPortuguesePotawatomiPuebloPuerto RicanPuget Sound SalishRomanianRussianSalvadoranSamoanScandinavianScotch-IrishScottishSeminoleSenegaleseSerbianShoshoneSierra LeoneanSiouxSlavicSlovakSloveneSomaliSouth AfricanSouth AmericanSouth American IndianSoviet UnionSpaniardSpanishSpanish AmericanSpanish American IndianSri LankanSubsaharan AfricanSudaneseSwedishSwissSyrianTaiwaneseThaiTlingit-HaidaTohono O'OdhamTonganTrinidadian and TobagonianTsimshianTurkishU.S. Virgin IslanderUgandanUkrainianUruguayanUteVenezuelanVietnameseWelshWest IndianYakamaYaquiYugoslavianYumanYup'ikZimbabwean
Immigration
NonimmigrantsImmigrantsAfghanistanAfricaAlbaniaArgentinaArmeniaAsiaAustraliaAustriaBahamasBangladeshBarbadosBelarusBelgiumBelizeBoliviaBosnia and HerzegovinaBrazilBulgariaBurma/MyanmarCabo VerdeCambodiaCameroonCanadaCaribbeanCentral AmericaChileColombiaCongoCosta RicaCroatiaCubaCzechoslovakiaDenmarkDominicaDominican RepublicEastern AfricaEastern AsiaEastern EuropeEcuadorEgyptEl SalvadorEnglandEritreaEthiopiaEuropeFijiFranceGermanyGhanaGreeceGrenadaGuatemalaGuyanaHaitiHondurasHong KongHungaryIndiaIndonesiaIranIraqIrelandIsraelItalyJamaicaJapanJordanKazakhstanKenyaKoreaKuwaitLaosLatin AmericaLatviaLebanonLiberiaLithuaniaMalaysiaMexicoMicronesiaMiddle AfricaMoldovaMoroccoNepalNetherlandsNicaraguaNigeriaNorth AmericaNorth MacedoniaNorthern AfricaNorthern EuropeNorwayOceaniaPakistanPanamaPeruPhilippinesPolandPortugalRomaniaRussiaSaudi ArabiaScotlandSenegalSerbiaSierra LeoneSingaporeSomaliaSouth AfricaSouth AmericaSouth Central AsiaSouth Eastern AsiaSouthern EuropeSpainSri LankaSt. Vincent and the GrenadinesSudanSwedenSwitzerlandSyriaTaiwanThailandTrinidad and TobagoTurkeyUgandaUkraineUruguayUzbekistanVenezuelaVietnamWest IndiesWestern AfricaWestern AsiaWestern EuropeYemenZaireZimbabweAzores
Immigrants from China
Race
Ancestry
AfghanAfricanAlaska NativeAlaskan AthabascanAlbanianAleutAlsatianAmericanApacheArabArapahoArgentineanArmenianAssyrian/Chaldean/SyriacAustralianBahamianBangladeshiBarbadianBasqueBelgianBelizeanBermudanBhutaneseBlackfeetBolivianBrazilianBritishBritish West IndianBulgarianBurmeseCajunCambodianCanadianCape VerdeanCarpatho RusynCelticCentral AmericanCentral American IndianCherokeeCheyenneChickasawChileanChineseChippewaChoctawColombianColvilleComancheCosta RicanCreeCreekCroatianCrowCubanCypriotCzechCzechoslovakianDanishDelawareDominicanDutchDutch West IndianEastern EuropeanEcuadorianEgyptianEnglishEstonianEthiopianEuropeanFijianFilipinoFinnishFrenchFrench American IndianFrench CanadianGermanGerman RussianGhanaianGreekGuamanian/ChamorroGuatemalanGuyaneseHaitianHmongHonduranHopiHoumaHungarianIcelanderIndian (Asian)IndonesianInupiatIranianIraqiIrishIroquoisIsraeliItalianJamaicanJapaneseJordanianKenyanKiowaKoreanLaotianLatvianLebaneseLiberianLithuanianLumbeeLuxembourgerMacedonianMalaysianMalteseMarshalleseMenomineeMexicanMexican American IndianMongolianMoroccanNative HawaiianNavajoNepaleseNew ZealanderNicaraguanNigerianNorthern EuropeanNorwegianOkinawanOsageOttawaPaiutePakistaniPalestinianPanamanianParaguayanPennsylvania GermanPeruvianPimaPolishPortuguesePotawatomiPuebloPuerto RicanPuget Sound SalishRomanianRussianSalvadoranSamoanScandinavianScotch-IrishScottishSeminoleSenegaleseSerbianShoshoneSierra LeoneanSiouxSlavicSlovakSloveneSomaliSouth AfricanSouth AmericanSouth American IndianSoviet UnionSpaniardSpanishSpanish AmericanSpanish American IndianSri LankanSubsaharan AfricanSudaneseSwedishSwissSyrianTaiwaneseThaiTlingit-HaidaTohono O'OdhamTonganTrinidadian and TobagonianTsimshianTurkishU.S. Virgin IslanderUgandanUkrainianUruguayanUteVenezuelanVietnameseWelshWest IndianYakamaYaquiYugoslavianYumanYup'ikZimbabwean
Immigration
NonimmigrantsImmigrantsAfghanistanAfricaAlbaniaArgentinaArmeniaAsiaAustraliaAustriaBahamasBangladeshBarbadosBelarusBelgiumBelizeBoliviaBosnia and HerzegovinaBrazilBulgariaBurma/MyanmarCabo VerdeCambodiaCameroonCanadaCaribbeanCentral AmericaChileChinaColombiaCongoCosta RicaCroatiaCubaCzechoslovakiaDenmarkDominicaDominican RepublicEastern AfricaEastern AsiaEastern EuropeEcuadorEgyptEl SalvadorEnglandEritreaEthiopiaEuropeFijiFranceGermanyGhanaGreeceGrenadaGuatemalaGuyanaHaitiHondurasHong KongHungaryIndiaIndonesiaIranIraqIrelandIsraelItalyJamaicaJapanJordanKazakhstanKenyaKoreaKuwaitLaosLatin AmericaLatviaLebanonLiberiaLithuaniaMalaysiaMexicoMicronesiaMiddle AfricaMoldovaMoroccoNepalNetherlandsNicaraguaNigeriaNorth AmericaNorth MacedoniaNorthern AfricaNorthern EuropeNorwayOceaniaPakistanPanamaPeruPhilippinesPolandPortugalRomaniaRussiaSaudi ArabiaScotlandSenegalSerbiaSierra LeoneSingaporeSomaliaSouth AfricaSouth AmericaSouth Central AsiaSouth Eastern AsiaSouthern EuropeSpainSri LankaSt. Vincent and the GrenadinesSudanSwedenSwitzerlandSyriaTaiwanThailandTrinidad and TobagoTurkeyUgandaUkraineUruguayUzbekistanVenezuelaVietnamWest IndiesWestern AfricaWestern AsiaWestern EuropeYemenZaireZimbabweAzores
Associate's Degree
Income
Poverty
Unemployment
Labor Participation
Family Structure
Vehicle Availability
Education Level
Disability

Associate's Degree Comparison

Austrians

Immigrants from China

Exceptional
Exceptional
49.1%
ASSOCIATE'S DEGREE
95.8/ 100
METRIC RATING
110th/ 347
METRIC RANK
55.5%
ASSOCIATE'S DEGREE
100.0/ 100
METRIC RATING
13th/ 347
METRIC RANK

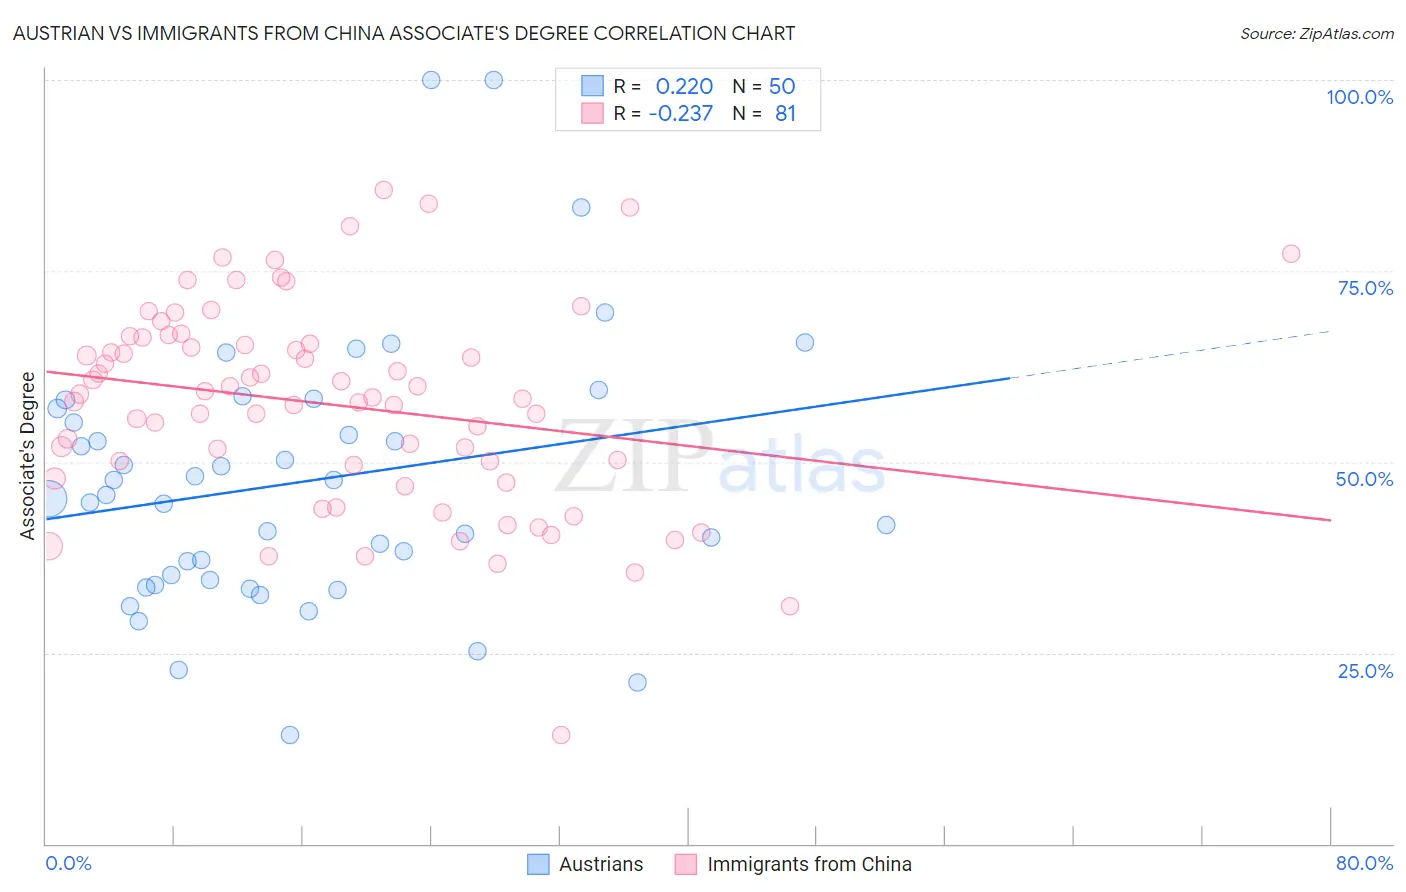
Austrian vs Immigrants from China Associate's Degree Correlation Chart

The statistical analysis conducted on geographies consisting of 452,054,791 people shows a weak positive correlation between the proportion of Austrians and percentage of population with at least associate's degree education in the United States with a correlation coefficient (R) of 0.220 and weighted average of 49.1%. Similarly, the statistical analysis conducted on geographies consisting of 457,025,047 people shows a weak negative correlation between the proportion of Immigrants from China and percentage of population with at least associate's degree education in the United States with a correlation coefficient (R) of -0.237 and weighted average of 55.5%, a difference of 13.0%.
Austrian vs Immigrants from China Associate's Degree

Associate's Degree Correlation Summary

MeasurementAustrianImmigrants from China
Minimum14.3%14.2%
Maximum100.0%85.6%
Range85.7%71.4%
Mean47.4%57.5%
Median45.5%58.5%
Interquartile 25% (IQ1)34.5%48.7%
Interquartile 75% (IQ3)57.0%65.9%
Interquartile Range (IQR)22.5%17.2%
Standard Deviation (Sample)17.5%13.4%
Standard Deviation (Population)17.3%13.3%

Similar Demographics by Associate's Degree

Demographics Similar to Austrians by Associate's Degree

In terms of associate's degree, the demographic groups most similar to Austrians are Immigrants from Venezuela (49.1%, a difference of 0.030%), Immigrants from Morocco (49.2%, a difference of 0.22%), Immigrants from Chile (49.0%, a difference of 0.22%), Palestinian (49.0%, a difference of 0.22%), and Arab (49.0%, a difference of 0.22%).
DemographicsRating | RankAssociate's Degree
Ukrainians
97.1
/100
|
#103
Exceptional
49.4%
Venezuelans
97.0
/100
|
#104
Exceptional
49.4%
Croatians
96.8
/100
|
#105
Exceptional
49.3%
Immigrants | Italy
96.7
/100
|
#106
Exceptional
49.3%
Syrians
96.7
/100
|
#107
Exceptional
49.3%
Jordanians
96.6
/100
|
#108
Exceptional
49.2%
Immigrants | Morocco
96.3
/100
|
#109
Exceptional
49.2%
Austrians
95.8
/100
|
#110
Exceptional
49.1%
Immigrants | Venezuela
95.8
/100
|
#111
Exceptional
49.1%
Immigrants | Chile
95.3
/100
|
#112
Exceptional
49.0%
Palestinians
95.3
/100
|
#113
Exceptional
49.0%
Arabs
95.3
/100
|
#114
Exceptional
49.0%
Luxembourgers
95.1
/100
|
#115
Exceptional
48.9%
British
95.0
/100
|
#116
Exceptional
48.9%
Afghans
94.8
/100
|
#117
Exceptional
48.9%

Demographics Similar to Immigrants from China by Associate's Degree

In terms of associate's degree, the demographic groups most similar to Immigrants from China are Immigrants from Hong Kong (55.4%, a difference of 0.14%), Immigrants from Eastern Asia (55.4%, a difference of 0.17%), Immigrants from South Central Asia (55.7%, a difference of 0.49%), Immigrants from Australia (55.8%, a difference of 0.61%), and Soviet Union (55.1%, a difference of 0.65%).
DemographicsRating | RankAssociate's Degree
Okinawans
100.0
/100
|
#6
Exceptional
57.7%
Immigrants | Iran
100.0
/100
|
#7
Exceptional
57.7%
Thais
100.0
/100
|
#8
Exceptional
57.4%
Immigrants | Israel
100.0
/100
|
#9
Exceptional
56.8%
Cypriots
100.0
/100
|
#10
Exceptional
56.4%
Immigrants | Australia
100.0
/100
|
#11
Exceptional
55.8%
Immigrants | South Central Asia
100.0
/100
|
#12
Exceptional
55.7%
Immigrants | China
100.0
/100
|
#13
Exceptional
55.5%
Immigrants | Hong Kong
100.0
/100
|
#14
Exceptional
55.4%
Immigrants | Eastern Asia
100.0
/100
|
#15
Exceptional
55.4%
Soviet Union
100.0
/100
|
#16
Exceptional
55.1%
Eastern Europeans
100.0
/100
|
#17
Exceptional
55.0%
Indians (Asian)
100.0
/100
|
#18
Exceptional
54.8%
Immigrants | Ireland
100.0
/100
|
#19
Exceptional
54.7%
Cambodians
100.0
/100
|
#20
Exceptional
54.6%