Austrian vs Immigrants from Indonesia Associate's Degree
COMPARE
Austrian
Immigrants from Indonesia
Associate's Degree
Associate's Degree Comparison
Austrians
Immigrants from Indonesia
49.1%
ASSOCIATE'S DEGREE
95.8/ 100
METRIC RATING
110th/ 347
METRIC RANK
51.0%
ASSOCIATE'S DEGREE
99.5/ 100
METRIC RATING
68th/ 347
METRIC RANK
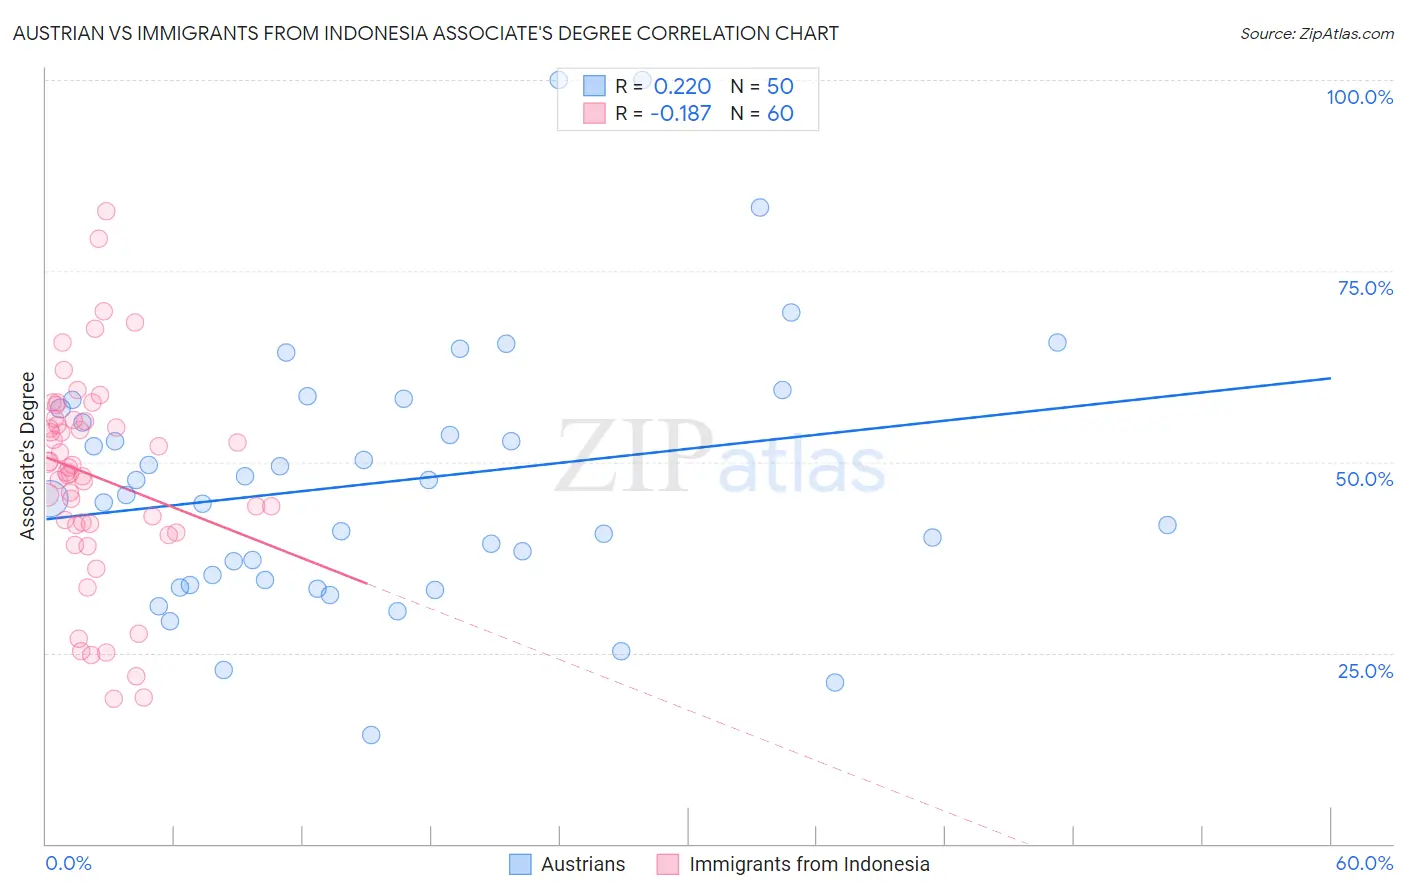
Austrian vs Immigrants from Indonesia Associate's Degree Correlation Chart
The statistical analysis conducted on geographies consisting of 452,054,791 people shows a weak positive correlation between the proportion of Austrians and percentage of population with at least associate's degree education in the United States with a correlation coefficient (R) of 0.220 and weighted average of 49.1%. Similarly, the statistical analysis conducted on geographies consisting of 215,779,806 people shows a poor negative correlation between the proportion of Immigrants from Indonesia and percentage of population with at least associate's degree education in the United States with a correlation coefficient (R) of -0.187 and weighted average of 51.0%, a difference of 3.9%.
Associate's Degree Correlation Summary
| Measurement | Austrian | Immigrants from Indonesia |
| Minimum | 14.3% | 19.0% |
| Maximum | 100.0% | 82.8% |
| Range | 85.7% | 63.7% |
| Mean | 47.4% | 48.1% |
| Median | 45.5% | 49.0% |
| Interquartile 25% (IQ1) | 34.5% | 41.9% |
| Interquartile 75% (IQ3) | 57.0% | 55.4% |
| Interquartile Range (IQR) | 22.5% | 13.5% |
| Standard Deviation (Sample) | 17.5% | 13.5% |
| Standard Deviation (Population) | 17.3% | 13.3% |
Similar Demographics by Associate's Degree
Demographics Similar to Austrians by Associate's Degree
In terms of associate's degree, the demographic groups most similar to Austrians are Immigrants from Venezuela (49.1%, a difference of 0.030%), Immigrants from Morocco (49.2%, a difference of 0.22%), Immigrants from Chile (49.0%, a difference of 0.22%), Palestinian (49.0%, a difference of 0.22%), and Arab (49.0%, a difference of 0.22%).
| Demographics | Rating | Rank | Associate's Degree |
| Ukrainians | 97.1 /100 | #103 | Exceptional 49.4% |
| Venezuelans | 97.0 /100 | #104 | Exceptional 49.4% |
| Croatians | 96.8 /100 | #105 | Exceptional 49.3% |
| Immigrants | Italy | 96.7 /100 | #106 | Exceptional 49.3% |
| Syrians | 96.7 /100 | #107 | Exceptional 49.3% |
| Jordanians | 96.6 /100 | #108 | Exceptional 49.2% |
| Immigrants | Morocco | 96.3 /100 | #109 | Exceptional 49.2% |
| Austrians | 95.8 /100 | #110 | Exceptional 49.1% |
| Immigrants | Venezuela | 95.8 /100 | #111 | Exceptional 49.1% |
| Immigrants | Chile | 95.3 /100 | #112 | Exceptional 49.0% |
| Palestinians | 95.3 /100 | #113 | Exceptional 49.0% |
| Arabs | 95.3 /100 | #114 | Exceptional 49.0% |
| Luxembourgers | 95.1 /100 | #115 | Exceptional 48.9% |
| British | 95.0 /100 | #116 | Exceptional 48.9% |
| Afghans | 94.8 /100 | #117 | Exceptional 48.9% |
Demographics Similar to Immigrants from Indonesia by Associate's Degree
In terms of associate's degree, the demographic groups most similar to Immigrants from Indonesia are Egyptian (50.9%, a difference of 0.12%), Immigrants from Argentina (50.9%, a difference of 0.15%), Immigrants from Romania (50.9%, a difference of 0.16%), Immigrants from Pakistan (50.9%, a difference of 0.22%), and Argentinean (51.2%, a difference of 0.49%).
| Demographics | Rating | Rank | Associate's Degree |
| Immigrants | Kazakhstan | 99.7 /100 | #61 | Exceptional 51.4% |
| Bhutanese | 99.7 /100 | #62 | Exceptional 51.4% |
| South Africans | 99.7 /100 | #63 | Exceptional 51.4% |
| Immigrants | Netherlands | 99.7 /100 | #64 | Exceptional 51.4% |
| Zimbabweans | 99.7 /100 | #65 | Exceptional 51.3% |
| Immigrants | Europe | 99.7 /100 | #66 | Exceptional 51.3% |
| Argentineans | 99.6 /100 | #67 | Exceptional 51.2% |
| Immigrants | Indonesia | 99.5 /100 | #68 | Exceptional 51.0% |
| Egyptians | 99.5 /100 | #69 | Exceptional 50.9% |
| Immigrants | Argentina | 99.5 /100 | #70 | Exceptional 50.9% |
| Immigrants | Romania | 99.5 /100 | #71 | Exceptional 50.9% |
| Immigrants | Pakistan | 99.5 /100 | #72 | Exceptional 50.9% |
| Carpatho Rusyns | 99.3 /100 | #73 | Exceptional 50.6% |
| Lithuanians | 99.3 /100 | #74 | Exceptional 50.6% |
| Immigrants | Scotland | 99.3 /100 | #75 | Exceptional 50.6% |