Egyptian vs Latvian Associate's Degree
COMPARE
Egyptian
Latvian
Associate's Degree
Associate's Degree Comparison
Egyptians
Latvians
50.9%
ASSOCIATE'S DEGREE
99.5/ 100
METRIC RATING
69th/ 347
METRIC RANK
53.9%
ASSOCIATE'S DEGREE
100.0/ 100
METRIC RATING
27th/ 347
METRIC RANK
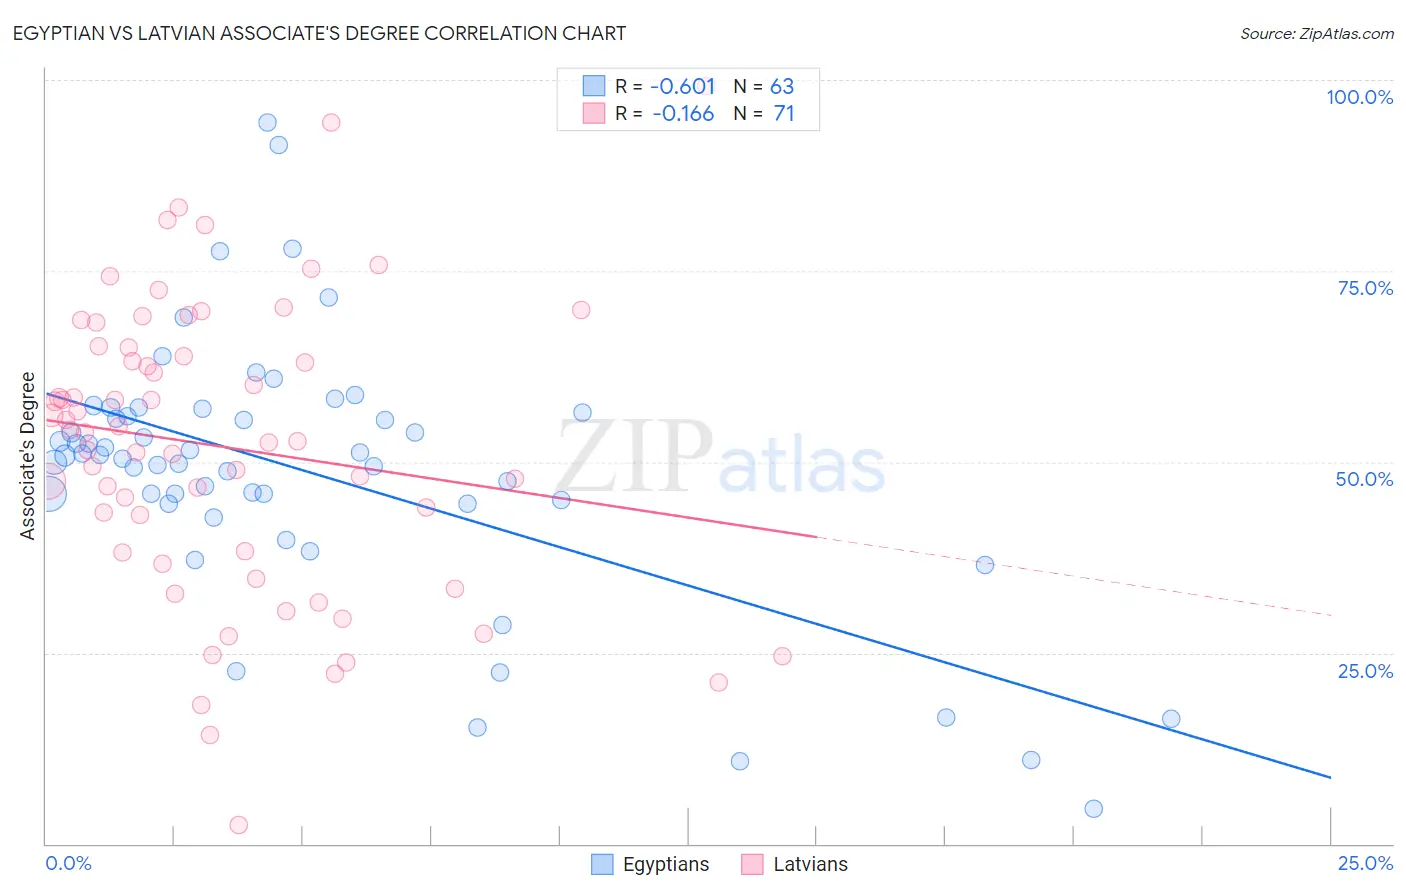
Egyptian vs Latvian Associate's Degree Correlation Chart
The statistical analysis conducted on geographies consisting of 276,910,507 people shows a significant negative correlation between the proportion of Egyptians and percentage of population with at least associate's degree education in the United States with a correlation coefficient (R) of -0.601 and weighted average of 50.9%. Similarly, the statistical analysis conducted on geographies consisting of 220,726,880 people shows a poor negative correlation between the proportion of Latvians and percentage of population with at least associate's degree education in the United States with a correlation coefficient (R) of -0.166 and weighted average of 53.9%, a difference of 5.9%.
Associate's Degree Correlation Summary
| Measurement | Egyptian | Latvian |
| Minimum | 4.6% | 2.4% |
| Maximum | 94.5% | 99.2% |
| Range | 89.9% | 96.7% |
| Mean | 48.7% | 51.9% |
| Median | 50.8% | 53.9% |
| Interquartile 25% (IQ1) | 44.6% | 38.1% |
| Interquartile 75% (IQ3) | 56.5% | 64.9% |
| Interquartile Range (IQR) | 11.9% | 26.9% |
| Standard Deviation (Sample) | 17.2% | 19.2% |
| Standard Deviation (Population) | 17.1% | 19.1% |
Similar Demographics by Associate's Degree
Demographics Similar to Egyptians by Associate's Degree
In terms of associate's degree, the demographic groups most similar to Egyptians are Immigrants from Argentina (50.9%, a difference of 0.030%), Immigrants from Romania (50.9%, a difference of 0.040%), Immigrants from Pakistan (50.9%, a difference of 0.10%), Immigrants from Indonesia (51.0%, a difference of 0.12%), and Carpatho Rusyn (50.6%, a difference of 0.57%).
| Demographics | Rating | Rank | Associate's Degree |
| Bhutanese | 99.7 /100 | #62 | Exceptional 51.4% |
| South Africans | 99.7 /100 | #63 | Exceptional 51.4% |
| Immigrants | Netherlands | 99.7 /100 | #64 | Exceptional 51.4% |
| Zimbabweans | 99.7 /100 | #65 | Exceptional 51.3% |
| Immigrants | Europe | 99.7 /100 | #66 | Exceptional 51.3% |
| Argentineans | 99.6 /100 | #67 | Exceptional 51.2% |
| Immigrants | Indonesia | 99.5 /100 | #68 | Exceptional 51.0% |
| Egyptians | 99.5 /100 | #69 | Exceptional 50.9% |
| Immigrants | Argentina | 99.5 /100 | #70 | Exceptional 50.9% |
| Immigrants | Romania | 99.5 /100 | #71 | Exceptional 50.9% |
| Immigrants | Pakistan | 99.5 /100 | #72 | Exceptional 50.9% |
| Carpatho Rusyns | 99.3 /100 | #73 | Exceptional 50.6% |
| Lithuanians | 99.3 /100 | #74 | Exceptional 50.6% |
| Immigrants | Scotland | 99.3 /100 | #75 | Exceptional 50.6% |
| Immigrants | Zimbabwe | 99.2 /100 | #76 | Exceptional 50.5% |
Demographics Similar to Latvians by Associate's Degree
In terms of associate's degree, the demographic groups most similar to Latvians are Turkish (53.9%, a difference of 0.070%), Immigrants from France (53.9%, a difference of 0.090%), Immigrants from Sri Lanka (53.7%, a difference of 0.50%), Immigrants from Northern Europe (53.5%, a difference of 0.87%), and Immigrants from Turkey (53.4%, a difference of 0.90%).
| Demographics | Rating | Rank | Associate's Degree |
| Cambodians | 100.0 /100 | #20 | Exceptional 54.6% |
| Immigrants | Sweden | 100.0 /100 | #21 | Exceptional 54.6% |
| Immigrants | Japan | 100.0 /100 | #22 | Exceptional 54.6% |
| Burmese | 100.0 /100 | #23 | Exceptional 54.6% |
| Immigrants | Korea | 100.0 /100 | #24 | Exceptional 54.5% |
| Immigrants | Switzerland | 100.0 /100 | #25 | Exceptional 54.5% |
| Immigrants | Belgium | 100.0 /100 | #26 | Exceptional 54.5% |
| Latvians | 100.0 /100 | #27 | Exceptional 53.9% |
| Turks | 100.0 /100 | #28 | Exceptional 53.9% |
| Immigrants | France | 100.0 /100 | #29 | Exceptional 53.9% |
| Immigrants | Sri Lanka | 100.0 /100 | #30 | Exceptional 53.7% |
| Immigrants | Northern Europe | 100.0 /100 | #31 | Exceptional 53.5% |
| Immigrants | Turkey | 100.0 /100 | #32 | Exceptional 53.4% |
| Israelis | 100.0 /100 | #33 | Exceptional 53.4% |
| Bulgarians | 100.0 /100 | #34 | Exceptional 53.3% |