Austrian vs Immigrants from Ethiopia Associate's Degree
COMPARE
Austrian
Immigrants from Ethiopia
Associate's Degree
Associate's Degree Comparison
Austrians
Immigrants from Ethiopia
49.1%
ASSOCIATE'S DEGREE
95.8/ 100
METRIC RATING
110th/ 347
METRIC RANK
50.1%
ASSOCIATE'S DEGREE
98.7/ 100
METRIC RATING
90th/ 347
METRIC RANK
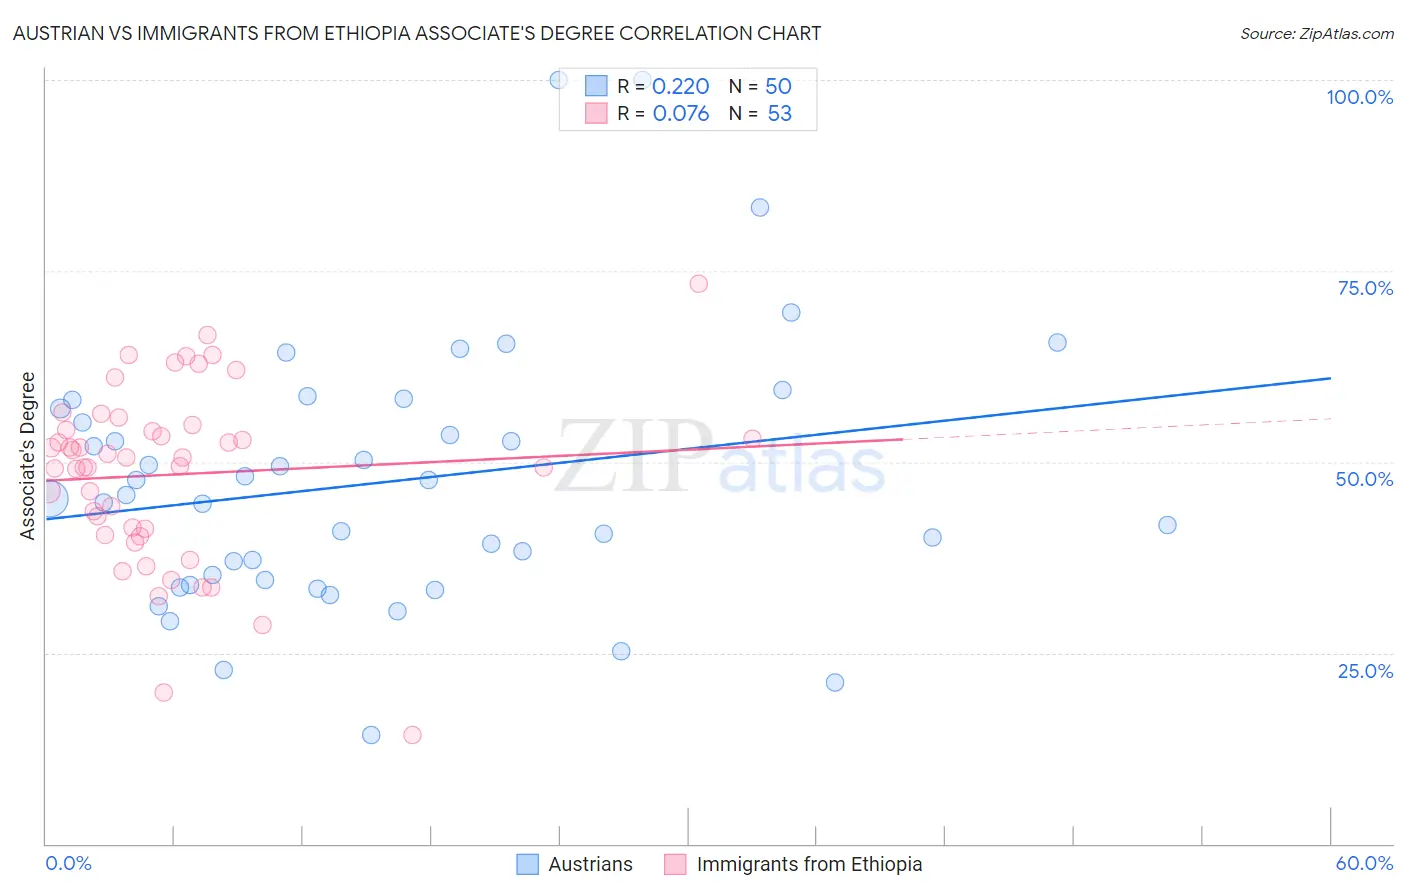
Austrian vs Immigrants from Ethiopia Associate's Degree Correlation Chart
The statistical analysis conducted on geographies consisting of 452,054,791 people shows a weak positive correlation between the proportion of Austrians and percentage of population with at least associate's degree education in the United States with a correlation coefficient (R) of 0.220 and weighted average of 49.1%. Similarly, the statistical analysis conducted on geographies consisting of 211,548,755 people shows a slight positive correlation between the proportion of Immigrants from Ethiopia and percentage of population with at least associate's degree education in the United States with a correlation coefficient (R) of 0.076 and weighted average of 50.1%, a difference of 2.1%.
Associate's Degree Correlation Summary
| Measurement | Austrian | Immigrants from Ethiopia |
| Minimum | 14.3% | 14.3% |
| Maximum | 100.0% | 73.3% |
| Range | 85.7% | 59.0% |
| Mean | 47.4% | 48.3% |
| Median | 45.5% | 50.5% |
| Interquartile 25% (IQ1) | 34.5% | 40.9% |
| Interquartile 75% (IQ3) | 57.0% | 54.5% |
| Interquartile Range (IQR) | 22.5% | 13.7% |
| Standard Deviation (Sample) | 17.5% | 11.6% |
| Standard Deviation (Population) | 17.3% | 11.5% |
Demographics Similar to Austrians and Immigrants from Ethiopia by Associate's Degree
In terms of associate's degree, the demographic groups most similar to Austrians are Immigrants from Morocco (49.2%, a difference of 0.22%), Jordanian (49.2%, a difference of 0.36%), Syrian (49.3%, a difference of 0.42%), Croatian (49.3%, a difference of 0.45%), and Immigrants from Italy (49.3%, a difference of 0.45%). Similarly, the demographic groups most similar to Immigrants from Ethiopia are Immigrants from Western Asia (50.1%, a difference of 0.080%), Immigrants from North America (50.1%, a difference of 0.10%), Immigrants from Brazil (50.0%, a difference of 0.25%), Laotian (49.9%, a difference of 0.39%), and Immigrants from England (49.7%, a difference of 0.78%).
| Demographics | Rating | Rank | Associate's Degree |
| Immigrants | Ethiopia | 98.7 /100 | #90 | Exceptional 50.1% |
| Immigrants | Western Asia | 98.7 /100 | #91 | Exceptional 50.1% |
| Immigrants | North America | 98.7 /100 | #92 | Exceptional 50.1% |
| Immigrants | Brazil | 98.5 /100 | #93 | Exceptional 50.0% |
| Laotians | 98.4 /100 | #94 | Exceptional 49.9% |
| Immigrants | England | 98.0 /100 | #95 | Exceptional 49.7% |
| Romanians | 98.0 /100 | #96 | Exceptional 49.7% |
| Immigrants | Ukraine | 98.0 /100 | #97 | Exceptional 49.7% |
| Immigrants | Northern Africa | 97.9 /100 | #98 | Exceptional 49.7% |
| Macedonians | 97.8 /100 | #99 | Exceptional 49.6% |
| Immigrants | Nepal | 97.5 /100 | #100 | Exceptional 49.5% |
| Northern Europeans | 97.3 /100 | #101 | Exceptional 49.5% |
| Chileans | 97.3 /100 | #102 | Exceptional 49.4% |
| Ukrainians | 97.1 /100 | #103 | Exceptional 49.4% |
| Venezuelans | 97.0 /100 | #104 | Exceptional 49.4% |
| Croatians | 96.8 /100 | #105 | Exceptional 49.3% |
| Immigrants | Italy | 96.7 /100 | #106 | Exceptional 49.3% |
| Syrians | 96.7 /100 | #107 | Exceptional 49.3% |
| Jordanians | 96.6 /100 | #108 | Exceptional 49.2% |
| Immigrants | Morocco | 96.3 /100 | #109 | Exceptional 49.2% |
| Austrians | 95.8 /100 | #110 | Exceptional 49.1% |