Slavic vs Latvian Associate's Degree
COMPARE
Slavic
Latvian
Associate's Degree
Associate's Degree Comparison
Slavs
Latvians
47.6%
ASSOCIATE'S DEGREE
80.5/ 100
METRIC RATING
144th/ 347
METRIC RANK
53.9%
ASSOCIATE'S DEGREE
100.0/ 100
METRIC RATING
27th/ 347
METRIC RANK
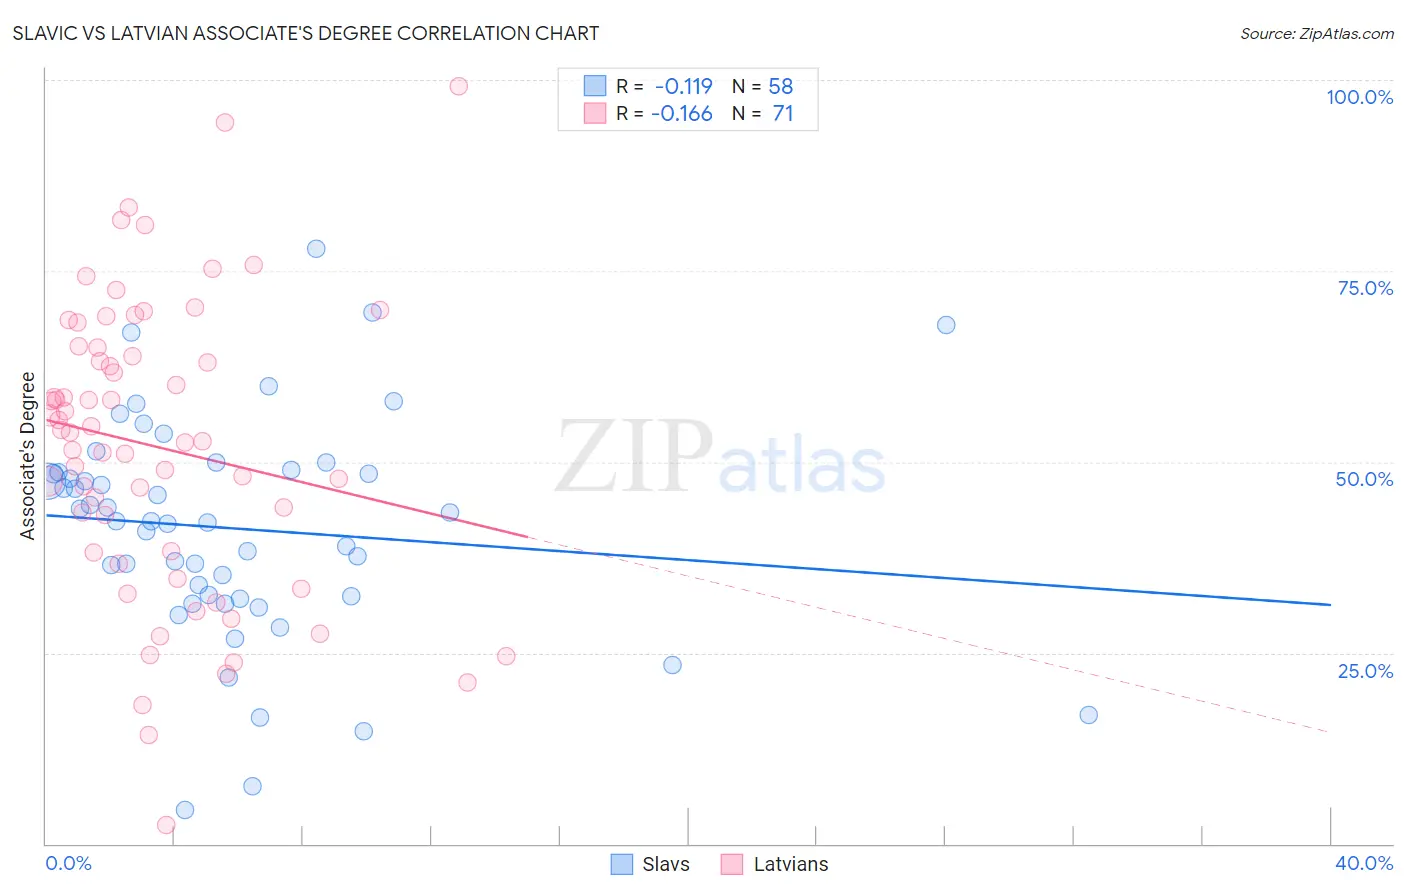
Slavic vs Latvian Associate's Degree Correlation Chart
The statistical analysis conducted on geographies consisting of 270,857,776 people shows a poor negative correlation between the proportion of Slavs and percentage of population with at least associate's degree education in the United States with a correlation coefficient (R) of -0.119 and weighted average of 47.6%. Similarly, the statistical analysis conducted on geographies consisting of 220,726,880 people shows a poor negative correlation between the proportion of Latvians and percentage of population with at least associate's degree education in the United States with a correlation coefficient (R) of -0.166 and weighted average of 53.9%, a difference of 13.3%.
Associate's Degree Correlation Summary
| Measurement | Slavic | Latvian |
| Minimum | 4.4% | 2.4% |
| Maximum | 77.9% | 99.2% |
| Range | 73.5% | 96.7% |
| Mean | 41.3% | 51.9% |
| Median | 42.2% | 53.9% |
| Interquartile 25% (IQ1) | 32.4% | 38.1% |
| Interquartile 75% (IQ3) | 48.7% | 64.9% |
| Interquartile Range (IQR) | 16.3% | 26.9% |
| Standard Deviation (Sample) | 14.5% | 19.2% |
| Standard Deviation (Population) | 14.4% | 19.1% |
Similar Demographics by Associate's Degree
Demographics Similar to Slavs by Associate's Degree
In terms of associate's degree, the demographic groups most similar to Slavs are Norwegian (47.6%, a difference of 0.060%), Canadian (47.5%, a difference of 0.17%), Sierra Leonean (47.7%, a difference of 0.29%), Immigrants from Sudan (47.4%, a difference of 0.30%), and Taiwanese (47.7%, a difference of 0.34%).
| Demographics | Rating | Rank | Associate's Degree |
| Immigrants | Eritrea | 87.8 /100 | #137 | Excellent 48.1% |
| Poles | 87.3 /100 | #138 | Excellent 48.0% |
| Slovenes | 85.1 /100 | #139 | Excellent 47.9% |
| Immigrants | Southern Europe | 84.4 /100 | #140 | Excellent 47.8% |
| Taiwanese | 83.3 /100 | #141 | Excellent 47.7% |
| Sierra Leoneans | 82.9 /100 | #142 | Excellent 47.7% |
| Norwegians | 81.0 /100 | #143 | Excellent 47.6% |
| Slavs | 80.5 /100 | #144 | Excellent 47.6% |
| Canadians | 79.0 /100 | #145 | Good 47.5% |
| Immigrants | Sudan | 77.9 /100 | #146 | Good 47.4% |
| Danes | 77.3 /100 | #147 | Good 47.4% |
| South American Indians | 76.7 /100 | #148 | Good 47.4% |
| Immigrants | Armenia | 76.6 /100 | #149 | Good 47.4% |
| Iraqis | 76.2 /100 | #150 | Good 47.4% |
| Immigrants | North Macedonia | 76.0 /100 | #151 | Good 47.4% |
Demographics Similar to Latvians by Associate's Degree
In terms of associate's degree, the demographic groups most similar to Latvians are Turkish (53.9%, a difference of 0.070%), Immigrants from France (53.9%, a difference of 0.090%), Immigrants from Sri Lanka (53.7%, a difference of 0.50%), Immigrants from Northern Europe (53.5%, a difference of 0.87%), and Immigrants from Turkey (53.4%, a difference of 0.90%).
| Demographics | Rating | Rank | Associate's Degree |
| Cambodians | 100.0 /100 | #20 | Exceptional 54.6% |
| Immigrants | Sweden | 100.0 /100 | #21 | Exceptional 54.6% |
| Immigrants | Japan | 100.0 /100 | #22 | Exceptional 54.6% |
| Burmese | 100.0 /100 | #23 | Exceptional 54.6% |
| Immigrants | Korea | 100.0 /100 | #24 | Exceptional 54.5% |
| Immigrants | Switzerland | 100.0 /100 | #25 | Exceptional 54.5% |
| Immigrants | Belgium | 100.0 /100 | #26 | Exceptional 54.5% |
| Latvians | 100.0 /100 | #27 | Exceptional 53.9% |
| Turks | 100.0 /100 | #28 | Exceptional 53.9% |
| Immigrants | France | 100.0 /100 | #29 | Exceptional 53.9% |
| Immigrants | Sri Lanka | 100.0 /100 | #30 | Exceptional 53.7% |
| Immigrants | Northern Europe | 100.0 /100 | #31 | Exceptional 53.5% |
| Immigrants | Turkey | 100.0 /100 | #32 | Exceptional 53.4% |
| Israelis | 100.0 /100 | #33 | Exceptional 53.4% |
| Bulgarians | 100.0 /100 | #34 | Exceptional 53.3% |