Austrian vs Immigrants from Dominica Associate's Degree
COMPARE
Austrian
Immigrants from Dominica
Associate's Degree
Associate's Degree Comparison
Austrians
Immigrants from Dominica
49.1%
ASSOCIATE'S DEGREE
95.8/ 100
METRIC RATING
110th/ 347
METRIC RANK
40.5%
ASSOCIATE'S DEGREE
0.1/ 100
METRIC RATING
274th/ 347
METRIC RANK
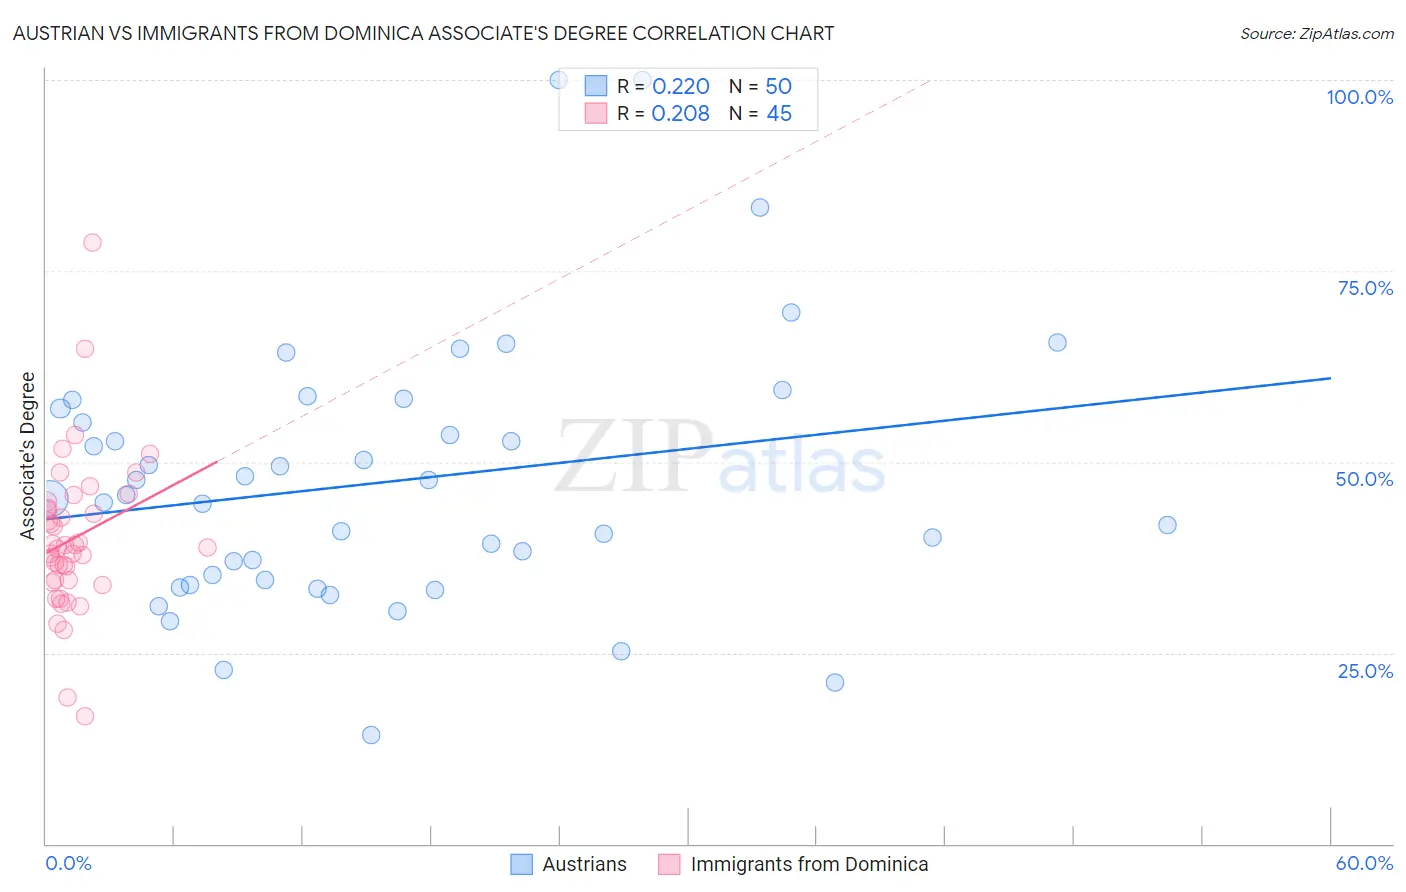
Austrian vs Immigrants from Dominica Associate's Degree Correlation Chart
The statistical analysis conducted on geographies consisting of 452,054,791 people shows a weak positive correlation between the proportion of Austrians and percentage of population with at least associate's degree education in the United States with a correlation coefficient (R) of 0.220 and weighted average of 49.1%. Similarly, the statistical analysis conducted on geographies consisting of 83,795,636 people shows a weak positive correlation between the proportion of Immigrants from Dominica and percentage of population with at least associate's degree education in the United States with a correlation coefficient (R) of 0.208 and weighted average of 40.5%, a difference of 21.3%.
Associate's Degree Correlation Summary
| Measurement | Austrian | Immigrants from Dominica |
| Minimum | 14.3% | 16.7% |
| Maximum | 100.0% | 78.8% |
| Range | 85.7% | 62.1% |
| Mean | 47.4% | 40.0% |
| Median | 45.5% | 38.9% |
| Interquartile 25% (IQ1) | 34.5% | 34.4% |
| Interquartile 75% (IQ3) | 57.0% | 44.3% |
| Interquartile Range (IQR) | 22.5% | 9.9% |
| Standard Deviation (Sample) | 17.5% | 10.3% |
| Standard Deviation (Population) | 17.3% | 10.2% |
Similar Demographics by Associate's Degree
Demographics Similar to Austrians by Associate's Degree
In terms of associate's degree, the demographic groups most similar to Austrians are Immigrants from Venezuela (49.1%, a difference of 0.030%), Immigrants from Morocco (49.2%, a difference of 0.22%), Immigrants from Chile (49.0%, a difference of 0.22%), Palestinian (49.0%, a difference of 0.22%), and Arab (49.0%, a difference of 0.22%).
| Demographics | Rating | Rank | Associate's Degree |
| Ukrainians | 97.1 /100 | #103 | Exceptional 49.4% |
| Venezuelans | 97.0 /100 | #104 | Exceptional 49.4% |
| Croatians | 96.8 /100 | #105 | Exceptional 49.3% |
| Immigrants | Italy | 96.7 /100 | #106 | Exceptional 49.3% |
| Syrians | 96.7 /100 | #107 | Exceptional 49.3% |
| Jordanians | 96.6 /100 | #108 | Exceptional 49.2% |
| Immigrants | Morocco | 96.3 /100 | #109 | Exceptional 49.2% |
| Austrians | 95.8 /100 | #110 | Exceptional 49.1% |
| Immigrants | Venezuela | 95.8 /100 | #111 | Exceptional 49.1% |
| Immigrants | Chile | 95.3 /100 | #112 | Exceptional 49.0% |
| Palestinians | 95.3 /100 | #113 | Exceptional 49.0% |
| Arabs | 95.3 /100 | #114 | Exceptional 49.0% |
| Luxembourgers | 95.1 /100 | #115 | Exceptional 48.9% |
| British | 95.0 /100 | #116 | Exceptional 48.9% |
| Afghans | 94.8 /100 | #117 | Exceptional 48.9% |
Demographics Similar to Immigrants from Dominica by Associate's Degree
In terms of associate's degree, the demographic groups most similar to Immigrants from Dominica are Puget Sound Salish (40.5%, a difference of 0.14%), Potawatomi (40.4%, a difference of 0.14%), Puerto Rican (40.4%, a difference of 0.25%), Blackfeet (40.3%, a difference of 0.30%), and Belizean (40.6%, a difference of 0.43%).
| Demographics | Rating | Rank | Associate's Degree |
| Hawaiians | 0.2 /100 | #267 | Tragic 40.9% |
| Central American Indians | 0.2 /100 | #268 | Tragic 40.8% |
| Americans | 0.2 /100 | #269 | Tragic 40.8% |
| Chippewa | 0.2 /100 | #270 | Tragic 40.7% |
| Immigrants | Laos | 0.1 /100 | #271 | Tragic 40.7% |
| Belizeans | 0.1 /100 | #272 | Tragic 40.6% |
| Puget Sound Salish | 0.1 /100 | #273 | Tragic 40.5% |
| Immigrants | Dominica | 0.1 /100 | #274 | Tragic 40.5% |
| Potawatomi | 0.1 /100 | #275 | Tragic 40.4% |
| Puerto Ricans | 0.1 /100 | #276 | Tragic 40.4% |
| Blackfeet | 0.1 /100 | #277 | Tragic 40.3% |
| Ottawa | 0.1 /100 | #278 | Tragic 40.3% |
| Immigrants | Nicaragua | 0.1 /100 | #279 | Tragic 40.3% |
| Immigrants | Micronesia | 0.1 /100 | #280 | Tragic 40.2% |
| Immigrants | Portugal | 0.1 /100 | #281 | Tragic 40.1% |