Austrian vs Ghanaian Associate's Degree
COMPARE
Austrian
Ghanaian
Associate's Degree
Associate's Degree Comparison
Austrians
Ghanaians
49.1%
ASSOCIATE'S DEGREE
95.8/ 100
METRIC RATING
110th/ 347
METRIC RANK
45.8%
ASSOCIATE'S DEGREE
35.5/ 100
METRIC RATING
188th/ 347
METRIC RANK
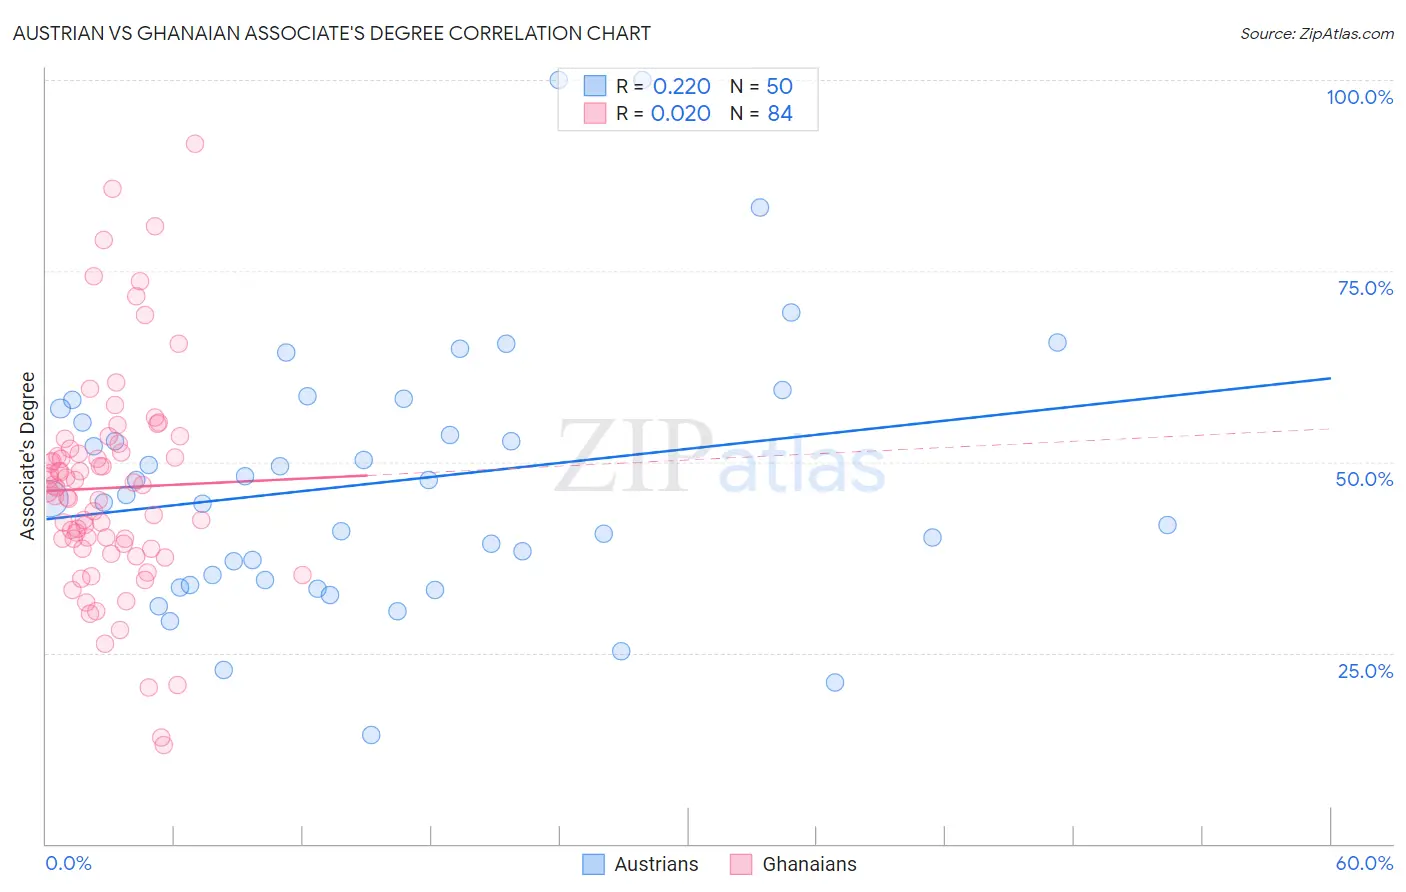
Austrian vs Ghanaian Associate's Degree Correlation Chart
The statistical analysis conducted on geographies consisting of 452,054,791 people shows a weak positive correlation between the proportion of Austrians and percentage of population with at least associate's degree education in the United States with a correlation coefficient (R) of 0.220 and weighted average of 49.1%. Similarly, the statistical analysis conducted on geographies consisting of 190,686,281 people shows no correlation between the proportion of Ghanaians and percentage of population with at least associate's degree education in the United States with a correlation coefficient (R) of 0.020 and weighted average of 45.8%, a difference of 7.1%.
Associate's Degree Correlation Summary
| Measurement | Austrian | Ghanaian |
| Minimum | 14.3% | 13.0% |
| Maximum | 100.0% | 91.7% |
| Range | 85.7% | 78.7% |
| Mean | 47.4% | 46.6% |
| Median | 45.5% | 46.4% |
| Interquartile 25% (IQ1) | 34.5% | 38.9% |
| Interquartile 75% (IQ3) | 57.0% | 51.4% |
| Interquartile Range (IQR) | 22.5% | 12.5% |
| Standard Deviation (Sample) | 17.5% | 14.3% |
| Standard Deviation (Population) | 17.3% | 14.2% |
Similar Demographics by Associate's Degree
Demographics Similar to Austrians by Associate's Degree
In terms of associate's degree, the demographic groups most similar to Austrians are Immigrants from Venezuela (49.1%, a difference of 0.030%), Immigrants from Morocco (49.2%, a difference of 0.22%), Immigrants from Chile (49.0%, a difference of 0.22%), Palestinian (49.0%, a difference of 0.22%), and Arab (49.0%, a difference of 0.22%).
| Demographics | Rating | Rank | Associate's Degree |
| Ukrainians | 97.1 /100 | #103 | Exceptional 49.4% |
| Venezuelans | 97.0 /100 | #104 | Exceptional 49.4% |
| Croatians | 96.8 /100 | #105 | Exceptional 49.3% |
| Immigrants | Italy | 96.7 /100 | #106 | Exceptional 49.3% |
| Syrians | 96.7 /100 | #107 | Exceptional 49.3% |
| Jordanians | 96.6 /100 | #108 | Exceptional 49.2% |
| Immigrants | Morocco | 96.3 /100 | #109 | Exceptional 49.2% |
| Austrians | 95.8 /100 | #110 | Exceptional 49.1% |
| Immigrants | Venezuela | 95.8 /100 | #111 | Exceptional 49.1% |
| Immigrants | Chile | 95.3 /100 | #112 | Exceptional 49.0% |
| Palestinians | 95.3 /100 | #113 | Exceptional 49.0% |
| Arabs | 95.3 /100 | #114 | Exceptional 49.0% |
| Luxembourgers | 95.1 /100 | #115 | Exceptional 48.9% |
| British | 95.0 /100 | #116 | Exceptional 48.9% |
| Afghans | 94.8 /100 | #117 | Exceptional 48.9% |
Demographics Similar to Ghanaians by Associate's Degree
In terms of associate's degree, the demographic groups most similar to Ghanaians are Immigrants from Uruguay (45.8%, a difference of 0.0%), Immigrants from Oceania (45.8%, a difference of 0.060%), Vietnamese (45.8%, a difference of 0.12%), Korean (45.8%, a difference of 0.13%), and Celtic (45.8%, a difference of 0.18%).
| Demographics | Rating | Rank | Associate's Degree |
| Immigrants | Colombia | 41.3 /100 | #181 | Average 46.0% |
| Swiss | 40.4 /100 | #182 | Average 46.0% |
| Yugoslavians | 40.2 /100 | #183 | Average 46.0% |
| Czechoslovakians | 40.0 /100 | #184 | Average 46.0% |
| Costa Ricans | 38.6 /100 | #185 | Fair 46.0% |
| Welsh | 37.9 /100 | #186 | Fair 45.9% |
| Immigrants | Uruguay | 35.5 /100 | #187 | Fair 45.8% |
| Ghanaians | 35.5 /100 | #188 | Fair 45.8% |
| Immigrants | Oceania | 34.7 /100 | #189 | Fair 45.8% |
| Vietnamese | 34.0 /100 | #190 | Fair 45.8% |
| Koreans | 33.8 /100 | #191 | Fair 45.8% |
| Celtics | 33.3 /100 | #192 | Fair 45.8% |
| Immigrants | Cameroon | 31.0 /100 | #193 | Fair 45.7% |
| Immigrants | Peru | 27.6 /100 | #194 | Fair 45.5% |
| Germans | 26.5 /100 | #195 | Fair 45.5% |