Austrian vs Immigrants from Belarus Associate's Degree
COMPARE
Austrian
Immigrants from Belarus
Associate's Degree
Associate's Degree Comparison
Austrians
Immigrants from Belarus
49.1%
ASSOCIATE'S DEGREE
95.8/ 100
METRIC RATING
110th/ 347
METRIC RANK
52.8%
ASSOCIATE'S DEGREE
99.9/ 100
METRIC RATING
39th/ 347
METRIC RANK
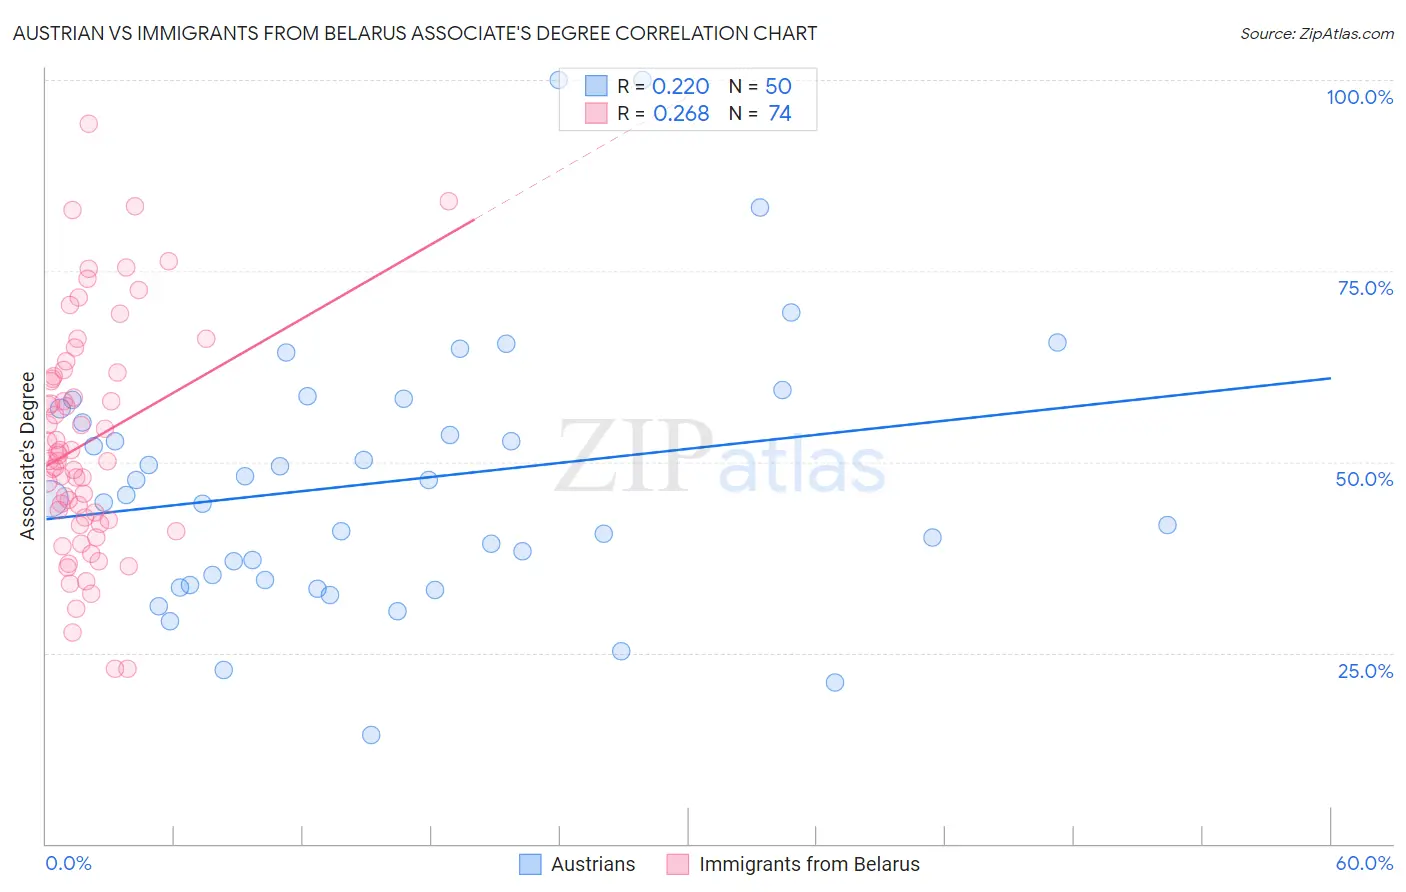
Austrian vs Immigrants from Belarus Associate's Degree Correlation Chart
The statistical analysis conducted on geographies consisting of 452,054,791 people shows a weak positive correlation between the proportion of Austrians and percentage of population with at least associate's degree education in the United States with a correlation coefficient (R) of 0.220 and weighted average of 49.1%. Similarly, the statistical analysis conducted on geographies consisting of 150,205,158 people shows a weak positive correlation between the proportion of Immigrants from Belarus and percentage of population with at least associate's degree education in the United States with a correlation coefficient (R) of 0.268 and weighted average of 52.8%, a difference of 7.6%.
Associate's Degree Correlation Summary
| Measurement | Austrian | Immigrants from Belarus |
| Minimum | 14.3% | 22.9% |
| Maximum | 100.0% | 94.2% |
| Range | 85.7% | 71.3% |
| Mean | 47.4% | 52.6% |
| Median | 45.5% | 50.5% |
| Interquartile 25% (IQ1) | 34.5% | 42.3% |
| Interquartile 75% (IQ3) | 57.0% | 61.3% |
| Interquartile Range (IQR) | 22.5% | 18.9% |
| Standard Deviation (Sample) | 17.5% | 14.8% |
| Standard Deviation (Population) | 17.3% | 14.7% |
Similar Demographics by Associate's Degree
Demographics Similar to Austrians by Associate's Degree
In terms of associate's degree, the demographic groups most similar to Austrians are Immigrants from Venezuela (49.1%, a difference of 0.030%), Immigrants from Morocco (49.2%, a difference of 0.22%), Immigrants from Chile (49.0%, a difference of 0.22%), Palestinian (49.0%, a difference of 0.22%), and Arab (49.0%, a difference of 0.22%).
| Demographics | Rating | Rank | Associate's Degree |
| Ukrainians | 97.1 /100 | #103 | Exceptional 49.4% |
| Venezuelans | 97.0 /100 | #104 | Exceptional 49.4% |
| Croatians | 96.8 /100 | #105 | Exceptional 49.3% |
| Immigrants | Italy | 96.7 /100 | #106 | Exceptional 49.3% |
| Syrians | 96.7 /100 | #107 | Exceptional 49.3% |
| Jordanians | 96.6 /100 | #108 | Exceptional 49.2% |
| Immigrants | Morocco | 96.3 /100 | #109 | Exceptional 49.2% |
| Austrians | 95.8 /100 | #110 | Exceptional 49.1% |
| Immigrants | Venezuela | 95.8 /100 | #111 | Exceptional 49.1% |
| Immigrants | Chile | 95.3 /100 | #112 | Exceptional 49.0% |
| Palestinians | 95.3 /100 | #113 | Exceptional 49.0% |
| Arabs | 95.3 /100 | #114 | Exceptional 49.0% |
| Luxembourgers | 95.1 /100 | #115 | Exceptional 48.9% |
| British | 95.0 /100 | #116 | Exceptional 48.9% |
| Afghans | 94.8 /100 | #117 | Exceptional 48.9% |
Demographics Similar to Immigrants from Belarus by Associate's Degree
In terms of associate's degree, the demographic groups most similar to Immigrants from Belarus are Immigrants from Latvia (52.8%, a difference of 0.070%), Mongolian (53.0%, a difference of 0.29%), Immigrants from Denmark (53.1%, a difference of 0.45%), Immigrants from Saudi Arabia (52.6%, a difference of 0.50%), and Immigrants from Russia (53.1%, a difference of 0.53%).
| Demographics | Rating | Rank | Associate's Degree |
| Immigrants | Turkey | 100.0 /100 | #32 | Exceptional 53.4% |
| Israelis | 100.0 /100 | #33 | Exceptional 53.4% |
| Bulgarians | 100.0 /100 | #34 | Exceptional 53.3% |
| Russians | 100.0 /100 | #35 | Exceptional 53.2% |
| Immigrants | Russia | 100.0 /100 | #36 | Exceptional 53.1% |
| Immigrants | Denmark | 100.0 /100 | #37 | Exceptional 53.1% |
| Mongolians | 100.0 /100 | #38 | Exceptional 53.0% |
| Immigrants | Belarus | 99.9 /100 | #39 | Exceptional 52.8% |
| Immigrants | Latvia | 99.9 /100 | #40 | Exceptional 52.8% |
| Immigrants | Saudi Arabia | 99.9 /100 | #41 | Exceptional 52.6% |
| Immigrants | Malaysia | 99.9 /100 | #42 | Exceptional 52.5% |
| Immigrants | South Africa | 99.9 /100 | #43 | Exceptional 52.5% |
| Estonians | 99.9 /100 | #44 | Exceptional 52.5% |
| Immigrants | Lithuania | 99.9 /100 | #45 | Exceptional 52.4% |
| Immigrants | Bulgaria | 99.9 /100 | #46 | Exceptional 52.4% |