Swiss vs Latvian Associate's Degree
COMPARE
Swiss
Latvian
Associate's Degree
Associate's Degree Comparison
Swiss
Latvians
46.0%
ASSOCIATE'S DEGREE
40.4/ 100
METRIC RATING
182nd/ 347
METRIC RANK
53.9%
ASSOCIATE'S DEGREE
100.0/ 100
METRIC RATING
27th/ 347
METRIC RANK
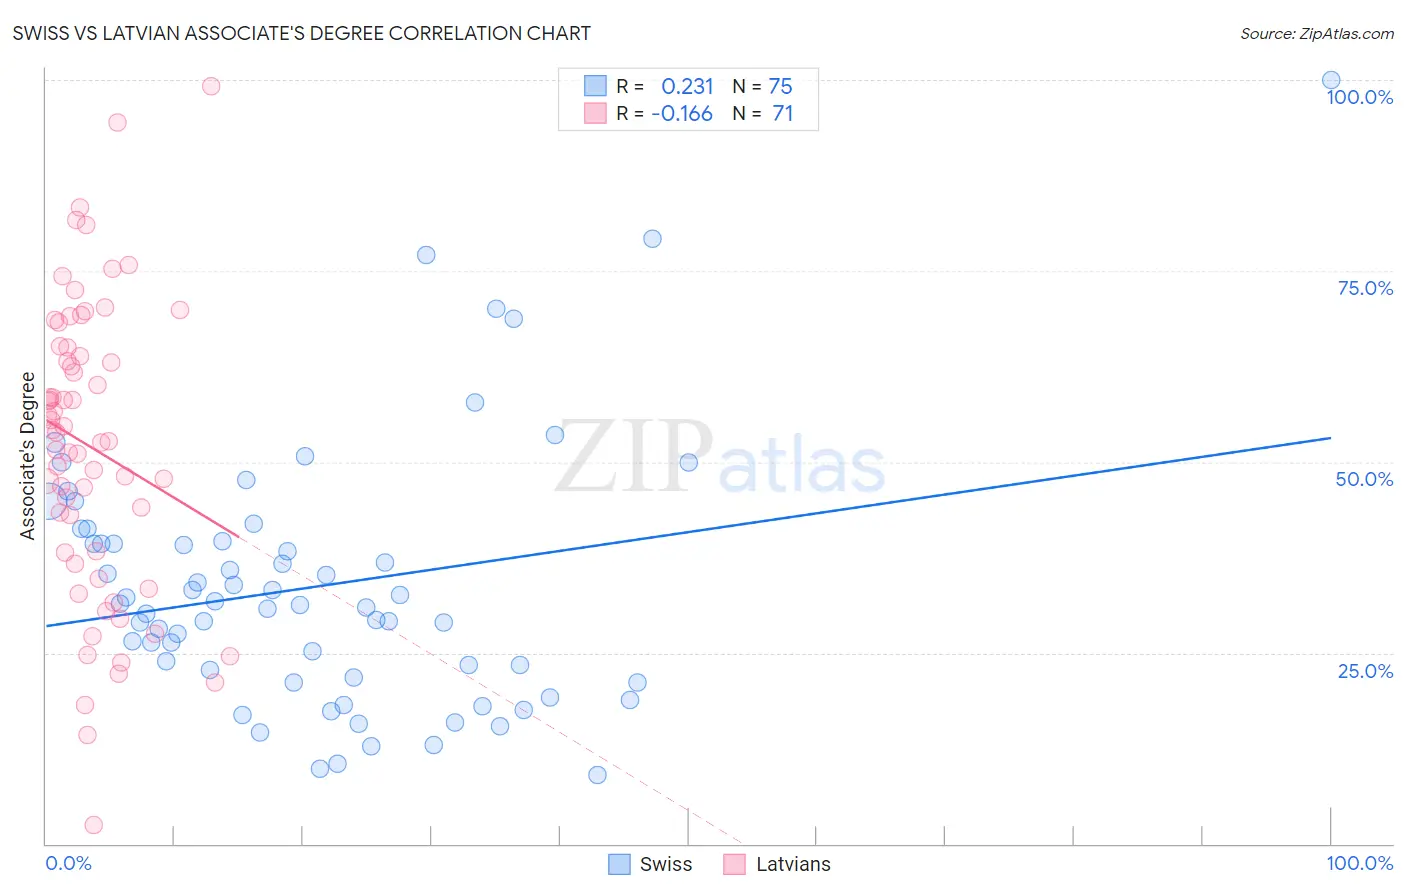
Swiss vs Latvian Associate's Degree Correlation Chart
The statistical analysis conducted on geographies consisting of 464,994,440 people shows a weak positive correlation between the proportion of Swiss and percentage of population with at least associate's degree education in the United States with a correlation coefficient (R) of 0.231 and weighted average of 46.0%. Similarly, the statistical analysis conducted on geographies consisting of 220,726,880 people shows a poor negative correlation between the proportion of Latvians and percentage of population with at least associate's degree education in the United States with a correlation coefficient (R) of -0.166 and weighted average of 53.9%, a difference of 17.2%.
Associate's Degree Correlation Summary
| Measurement | Swiss | Latvian |
| Minimum | 8.9% | 2.4% |
| Maximum | 100.0% | 99.2% |
| Range | 91.1% | 96.7% |
| Mean | 33.6% | 51.9% |
| Median | 31.2% | 53.9% |
| Interquartile 25% (IQ1) | 21.8% | 38.1% |
| Interquartile 75% (IQ3) | 39.6% | 64.9% |
| Interquartile Range (IQR) | 17.8% | 26.9% |
| Standard Deviation (Sample) | 16.9% | 19.2% |
| Standard Deviation (Population) | 16.8% | 19.1% |
Similar Demographics by Associate's Degree
Demographics Similar to Swiss by Associate's Degree
In terms of associate's degree, the demographic groups most similar to Swiss are Yugoslavian (46.0%, a difference of 0.010%), Czechoslovakian (46.0%, a difference of 0.030%), Immigrants from Colombia (46.0%, a difference of 0.070%), Costa Rican (46.0%, a difference of 0.14%), and Welsh (45.9%, a difference of 0.20%).
| Demographics | Rating | Rank | Associate's Degree |
| Belgians | 48.9 /100 | #175 | Average 46.3% |
| Finns | 48.5 /100 | #176 | Average 46.3% |
| Slovaks | 48.4 /100 | #177 | Average 46.3% |
| Immigrants | Bosnia and Herzegovina | 48.3 /100 | #178 | Average 46.3% |
| Sri Lankans | 47.6 /100 | #179 | Average 46.3% |
| Bermudans | 46.4 /100 | #180 | Average 46.2% |
| Immigrants | Colombia | 41.3 /100 | #181 | Average 46.0% |
| Swiss | 40.4 /100 | #182 | Average 46.0% |
| Yugoslavians | 40.2 /100 | #183 | Average 46.0% |
| Czechoslovakians | 40.0 /100 | #184 | Average 46.0% |
| Costa Ricans | 38.6 /100 | #185 | Fair 46.0% |
| Welsh | 37.9 /100 | #186 | Fair 45.9% |
| Immigrants | Uruguay | 35.5 /100 | #187 | Fair 45.8% |
| Ghanaians | 35.5 /100 | #188 | Fair 45.8% |
| Immigrants | Oceania | 34.7 /100 | #189 | Fair 45.8% |
Demographics Similar to Latvians by Associate's Degree
In terms of associate's degree, the demographic groups most similar to Latvians are Turkish (53.9%, a difference of 0.070%), Immigrants from France (53.9%, a difference of 0.090%), Immigrants from Sri Lanka (53.7%, a difference of 0.50%), Immigrants from Northern Europe (53.5%, a difference of 0.87%), and Immigrants from Turkey (53.4%, a difference of 0.90%).
| Demographics | Rating | Rank | Associate's Degree |
| Cambodians | 100.0 /100 | #20 | Exceptional 54.6% |
| Immigrants | Sweden | 100.0 /100 | #21 | Exceptional 54.6% |
| Immigrants | Japan | 100.0 /100 | #22 | Exceptional 54.6% |
| Burmese | 100.0 /100 | #23 | Exceptional 54.6% |
| Immigrants | Korea | 100.0 /100 | #24 | Exceptional 54.5% |
| Immigrants | Switzerland | 100.0 /100 | #25 | Exceptional 54.5% |
| Immigrants | Belgium | 100.0 /100 | #26 | Exceptional 54.5% |
| Latvians | 100.0 /100 | #27 | Exceptional 53.9% |
| Turks | 100.0 /100 | #28 | Exceptional 53.9% |
| Immigrants | France | 100.0 /100 | #29 | Exceptional 53.9% |
| Immigrants | Sri Lanka | 100.0 /100 | #30 | Exceptional 53.7% |
| Immigrants | Northern Europe | 100.0 /100 | #31 | Exceptional 53.5% |
| Immigrants | Turkey | 100.0 /100 | #32 | Exceptional 53.4% |
| Israelis | 100.0 /100 | #33 | Exceptional 53.4% |
| Bulgarians | 100.0 /100 | #34 | Exceptional 53.3% |