Austrian vs Ecuadorian Associate's Degree

COMPARE

Austrian
Race
Ancestry
AfghanAfricanAlaska NativeAlaskan AthabascanAlbanianAleutAlsatianAmericanApacheArabArapahoArgentineanArmenianAssyrian/Chaldean/SyriacAustralianAustrianBahamianBangladeshiBarbadianBasqueBelgianBelizeanBermudanBhutaneseBlackfeetBolivianBrazilianBritishBritish West IndianBulgarianBurmeseCajunCambodianCanadianCape VerdeanCarpatho RusynCelticCentral AmericanCentral American IndianCherokeeCheyenneChickasawChileanChineseChippewaChoctawColombianColvilleComancheCosta RicanCreeCreekCroatianCrowCubanCypriotCzechCzechoslovakianDanishDelawareDominicanDutchDutch West IndianEastern EuropeanEgyptianEnglishEstonianEthiopianEuropeanFijianFilipinoFinnishFrenchFrench American IndianFrench CanadianGermanGerman RussianGhanaianGreekGuamanian/ChamorroGuatemalanGuyaneseHaitianHmongHonduranHopiHoumaHungarianIcelanderIndian (Asian)IndonesianInupiatIranianIraqiIrishIroquoisIsraeliItalianJamaicanJapaneseJordanianKenyanKiowaKoreanLaotianLatvianLebaneseLiberianLithuanianLumbeeLuxembourgerMacedonianMalaysianMalteseMarshalleseMenomineeMexicanMexican American IndianMongolianMoroccanNative HawaiianNavajoNepaleseNew ZealanderNicaraguanNigerianNorthern EuropeanNorwegianOkinawanOsageOttawaPaiutePakistaniPalestinianPanamanianParaguayanPennsylvania GermanPeruvianPimaPolishPortuguesePotawatomiPuebloPuerto RicanPuget Sound SalishRomanianRussianSalvadoranSamoanScandinavianScotch-IrishScottishSeminoleSenegaleseSerbianShoshoneSierra LeoneanSiouxSlavicSlovakSloveneSomaliSouth AfricanSouth AmericanSouth American IndianSoviet UnionSpaniardSpanishSpanish AmericanSpanish American IndianSri LankanSubsaharan AfricanSudaneseSwedishSwissSyrianTaiwaneseThaiTlingit-HaidaTohono O'OdhamTonganTrinidadian and TobagonianTsimshianTurkishU.S. Virgin IslanderUgandanUkrainianUruguayanUteVenezuelanVietnameseWelshWest IndianYakamaYaquiYugoslavianYumanYup'ikZimbabwean
Immigration
NonimmigrantsImmigrantsAfghanistanAfricaAlbaniaArgentinaArmeniaAsiaAustraliaAustriaBahamasBangladeshBarbadosBelarusBelgiumBelizeBoliviaBosnia and HerzegovinaBrazilBulgariaBurma/MyanmarCabo VerdeCambodiaCameroonCanadaCaribbeanCentral AmericaChileChinaColombiaCongoCosta RicaCroatiaCubaCzechoslovakiaDenmarkDominicaDominican RepublicEastern AfricaEastern AsiaEastern EuropeEcuadorEgyptEl SalvadorEnglandEritreaEthiopiaEuropeFijiFranceGermanyGhanaGreeceGrenadaGuatemalaGuyanaHaitiHondurasHong KongHungaryIndiaIndonesiaIranIraqIrelandIsraelItalyJamaicaJapanJordanKazakhstanKenyaKoreaKuwaitLaosLatin AmericaLatviaLebanonLiberiaLithuaniaMalaysiaMexicoMicronesiaMiddle AfricaMoldovaMoroccoNepalNetherlandsNicaraguaNigeriaNorth AmericaNorth MacedoniaNorthern AfricaNorthern EuropeNorwayOceaniaPakistanPanamaPeruPhilippinesPolandPortugalRomaniaRussiaSaudi ArabiaScotlandSenegalSerbiaSierra LeoneSingaporeSomaliaSouth AfricaSouth AmericaSouth Central AsiaSouth Eastern AsiaSouthern EuropeSpainSri LankaSt. Vincent and the GrenadinesSudanSwedenSwitzerlandSyriaTaiwanThailandTrinidad and TobagoTurkeyUgandaUkraineUruguayUzbekistanVenezuelaVietnamWest IndiesWestern AfricaWestern AsiaWestern EuropeYemenZaireZimbabweAzores
Ecuadorian
Race
Ancestry
AfghanAfricanAlaska NativeAlaskan AthabascanAlbanianAleutAlsatianAmericanApacheArabArapahoArgentineanArmenianAssyrian/Chaldean/SyriacAustralianBahamianBangladeshiBarbadianBasqueBelgianBelizeanBermudanBhutaneseBlackfeetBolivianBrazilianBritishBritish West IndianBulgarianBurmeseCajunCambodianCanadianCape VerdeanCarpatho RusynCelticCentral AmericanCentral American IndianCherokeeCheyenneChickasawChileanChineseChippewaChoctawColombianColvilleComancheCosta RicanCreeCreekCroatianCrowCubanCypriotCzechCzechoslovakianDanishDelawareDominicanDutchDutch West IndianEastern EuropeanEcuadorianEgyptianEnglishEstonianEthiopianEuropeanFijianFilipinoFinnishFrenchFrench American IndianFrench CanadianGermanGerman RussianGhanaianGreekGuamanian/ChamorroGuatemalanGuyaneseHaitianHmongHonduranHopiHoumaHungarianIcelanderIndian (Asian)IndonesianInupiatIranianIraqiIrishIroquoisIsraeliItalianJamaicanJapaneseJordanianKenyanKiowaKoreanLaotianLatvianLebaneseLiberianLithuanianLumbeeLuxembourgerMacedonianMalaysianMalteseMarshalleseMenomineeMexicanMexican American IndianMongolianMoroccanNative HawaiianNavajoNepaleseNew ZealanderNicaraguanNigerianNorthern EuropeanNorwegianOkinawanOsageOttawaPaiutePakistaniPalestinianPanamanianParaguayanPennsylvania GermanPeruvianPimaPolishPortuguesePotawatomiPuebloPuerto RicanPuget Sound SalishRomanianRussianSalvadoranSamoanScandinavianScotch-IrishScottishSeminoleSenegaleseSerbianShoshoneSierra LeoneanSiouxSlavicSlovakSloveneSomaliSouth AfricanSouth AmericanSouth American IndianSoviet UnionSpaniardSpanishSpanish AmericanSpanish American IndianSri LankanSubsaharan AfricanSudaneseSwedishSwissSyrianTaiwaneseThaiTlingit-HaidaTohono O'OdhamTonganTrinidadian and TobagonianTsimshianTurkishU.S. Virgin IslanderUgandanUkrainianUruguayanUteVenezuelanVietnameseWelshWest IndianYakamaYaquiYugoslavianYumanYup'ikZimbabwean
Immigration
NonimmigrantsImmigrantsAfghanistanAfricaAlbaniaArgentinaArmeniaAsiaAustraliaAustriaBahamasBangladeshBarbadosBelarusBelgiumBelizeBoliviaBosnia and HerzegovinaBrazilBulgariaBurma/MyanmarCabo VerdeCambodiaCameroonCanadaCaribbeanCentral AmericaChileChinaColombiaCongoCosta RicaCroatiaCubaCzechoslovakiaDenmarkDominicaDominican RepublicEastern AfricaEastern AsiaEastern EuropeEcuadorEgyptEl SalvadorEnglandEritreaEthiopiaEuropeFijiFranceGermanyGhanaGreeceGrenadaGuatemalaGuyanaHaitiHondurasHong KongHungaryIndiaIndonesiaIranIraqIrelandIsraelItalyJamaicaJapanJordanKazakhstanKenyaKoreaKuwaitLaosLatin AmericaLatviaLebanonLiberiaLithuaniaMalaysiaMexicoMicronesiaMiddle AfricaMoldovaMoroccoNepalNetherlandsNicaraguaNigeriaNorth AmericaNorth MacedoniaNorthern AfricaNorthern EuropeNorwayOceaniaPakistanPanamaPeruPhilippinesPolandPortugalRomaniaRussiaSaudi ArabiaScotlandSenegalSerbiaSierra LeoneSingaporeSomaliaSouth AfricaSouth AmericaSouth Central AsiaSouth Eastern AsiaSouthern EuropeSpainSri LankaSt. Vincent and the GrenadinesSudanSwedenSwitzerlandSyriaTaiwanThailandTrinidad and TobagoTurkeyUgandaUkraineUruguayUzbekistanVenezuelaVietnamWest IndiesWestern AfricaWestern AsiaWestern EuropeYemenZaireZimbabweAzores
Associate's Degree
Income
Poverty
Unemployment
Labor Participation
Family Structure
Vehicle Availability
Education Level
Disability

Associate's Degree Comparison

Austrians

Ecuadorians

Exceptional
Tragic
49.1%
ASSOCIATE'S DEGREE
95.8/ 100
METRIC RATING
110th/ 347
METRIC RANK
43.0%
ASSOCIATE'S DEGREE
2.0/ 100
METRIC RATING
235th/ 347
METRIC RANK

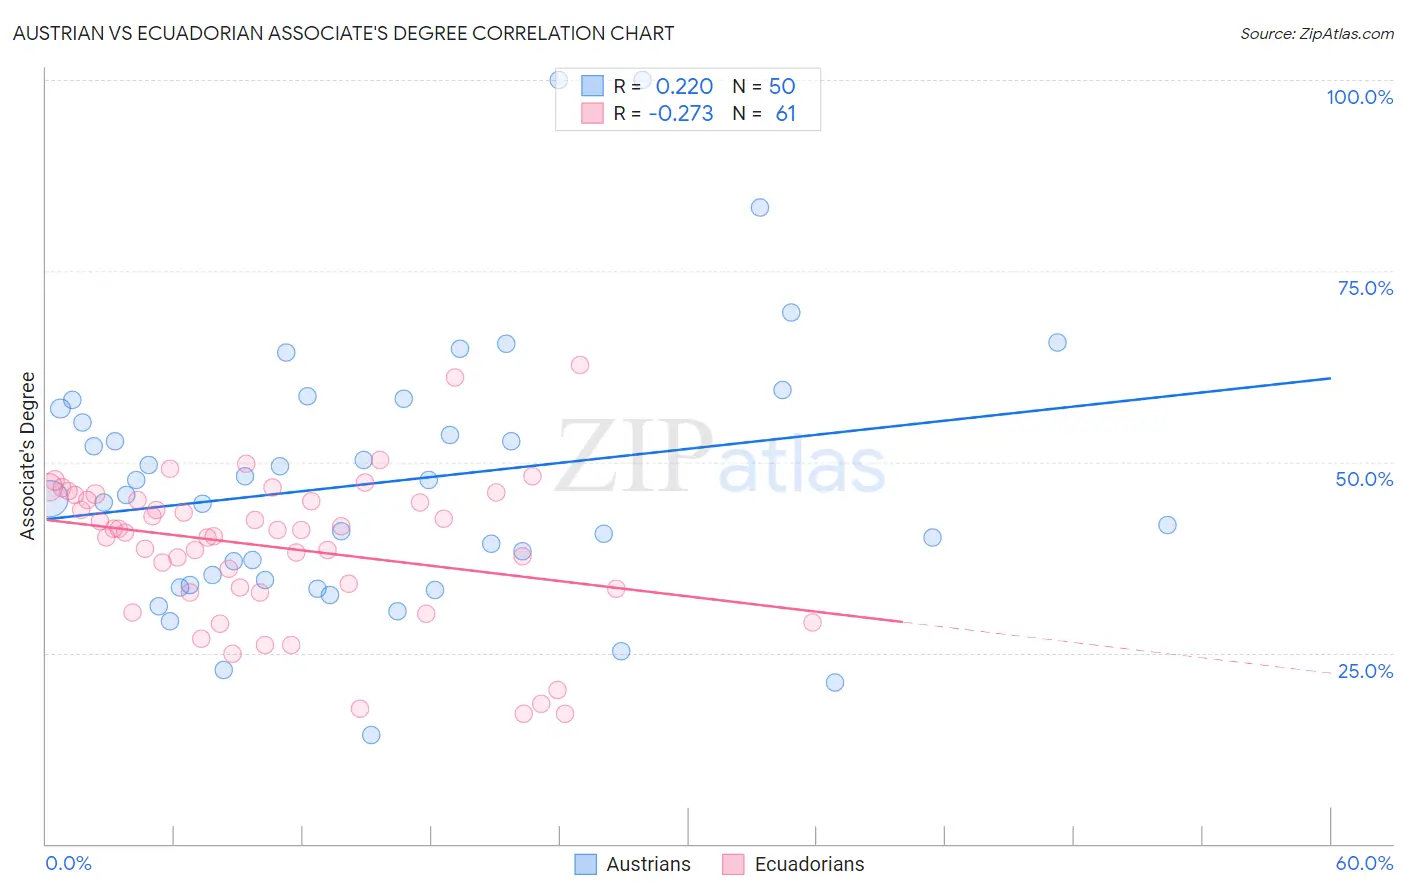
Austrian vs Ecuadorian Associate's Degree Correlation Chart

The statistical analysis conducted on geographies consisting of 452,054,791 people shows a weak positive correlation between the proportion of Austrians and percentage of population with at least associate's degree education in the United States with a correlation coefficient (R) of 0.220 and weighted average of 49.1%. Similarly, the statistical analysis conducted on geographies consisting of 317,844,783 people shows a weak negative correlation between the proportion of Ecuadorians and percentage of population with at least associate's degree education in the United States with a correlation coefficient (R) of -0.273 and weighted average of 43.0%, a difference of 14.2%.
Austrian vs Ecuadorian Associate's Degree

Associate's Degree Correlation Summary

MeasurementAustrianEcuadorian
Minimum14.3%16.9%
Maximum100.0%62.8%
Range85.7%45.8%
Mean47.4%38.8%
Median45.5%41.1%
Interquartile 25% (IQ1)34.5%33.1%
Interquartile 75% (IQ3)57.0%45.4%
Interquartile Range (IQR)22.5%12.3%
Standard Deviation (Sample)17.5%9.7%
Standard Deviation (Population)17.3%9.7%

Similar Demographics by Associate's Degree

Demographics Similar to Austrians by Associate's Degree

In terms of associate's degree, the demographic groups most similar to Austrians are Immigrants from Venezuela (49.1%, a difference of 0.030%), Immigrants from Morocco (49.2%, a difference of 0.22%), Immigrants from Chile (49.0%, a difference of 0.22%), Palestinian (49.0%, a difference of 0.22%), and Arab (49.0%, a difference of 0.22%).
DemographicsRating | RankAssociate's Degree
Ukrainians
97.1
/100
|
#103
Exceptional
49.4%
Venezuelans
97.0
/100
|
#104
Exceptional
49.4%
Croatians
96.8
/100
|
#105
Exceptional
49.3%
Immigrants | Italy
96.7
/100
|
#106
Exceptional
49.3%
Syrians
96.7
/100
|
#107
Exceptional
49.3%
Jordanians
96.6
/100
|
#108
Exceptional
49.2%
Immigrants | Morocco
96.3
/100
|
#109
Exceptional
49.2%
Austrians
95.8
/100
|
#110
Exceptional
49.1%
Immigrants | Venezuela
95.8
/100
|
#111
Exceptional
49.1%
Immigrants | Chile
95.3
/100
|
#112
Exceptional
49.0%
Palestinians
95.3
/100
|
#113
Exceptional
49.0%
Arabs
95.3
/100
|
#114
Exceptional
49.0%
Luxembourgers
95.1
/100
|
#115
Exceptional
48.9%
British
95.0
/100
|
#116
Exceptional
48.9%
Afghans
94.8
/100
|
#117
Exceptional
48.9%

Demographics Similar to Ecuadorians by Associate's Degree

In terms of associate's degree, the demographic groups most similar to Ecuadorians are Immigrants from St. Vincent and the Grenadines (42.9%, a difference of 0.080%), Tlingit-Haida (43.0%, a difference of 0.090%), Nonimmigrants (42.9%, a difference of 0.10%), Tongan (43.0%, a difference of 0.19%), and Native Hawaiian (43.1%, a difference of 0.35%).
DemographicsRating | RankAssociate's Degree
Hmong
3.2
/100
|
#228
Tragic
43.4%
Immigrants | Trinidad and Tobago
3.0
/100
|
#229
Tragic
43.3%
Immigrants | Barbados
2.9
/100
|
#230
Tragic
43.3%
Liberians
2.9
/100
|
#231
Tragic
43.3%
Native Hawaiians
2.3
/100
|
#232
Tragic
43.1%
Tongans
2.2
/100
|
#233
Tragic
43.0%
Tlingit-Haida
2.1
/100
|
#234
Tragic
43.0%
Ecuadorians
2.0
/100
|
#235
Tragic
43.0%
Immigrants | St. Vincent and the Grenadines
1.9
/100
|
#236
Tragic
42.9%
Immigrants | Nonimmigrants
1.9
/100
|
#237
Tragic
42.9%
Iroquois
1.7
/100
|
#238
Tragic
42.8%
Immigrants | Grenada
1.3
/100
|
#239
Tragic
42.6%
Cree
1.2
/100
|
#240
Tragic
42.5%
British West Indians
1.0
/100
|
#241
Tragic
42.4%
Immigrants | West Indies
1.0
/100
|
#242
Tragic
42.4%