Austrian vs Latvian Female Disability
COMPARE
Austrian
Latvian
Female Disability
Female Disability Comparison
Austrians
Latvians
12.3%
FEMALE DISABILITY
33.3/ 100
METRIC RATING
186th/ 347
METRIC RANK
11.7%
FEMALE DISABILITY
98.2/ 100
METRIC RATING
107th/ 347
METRIC RANK
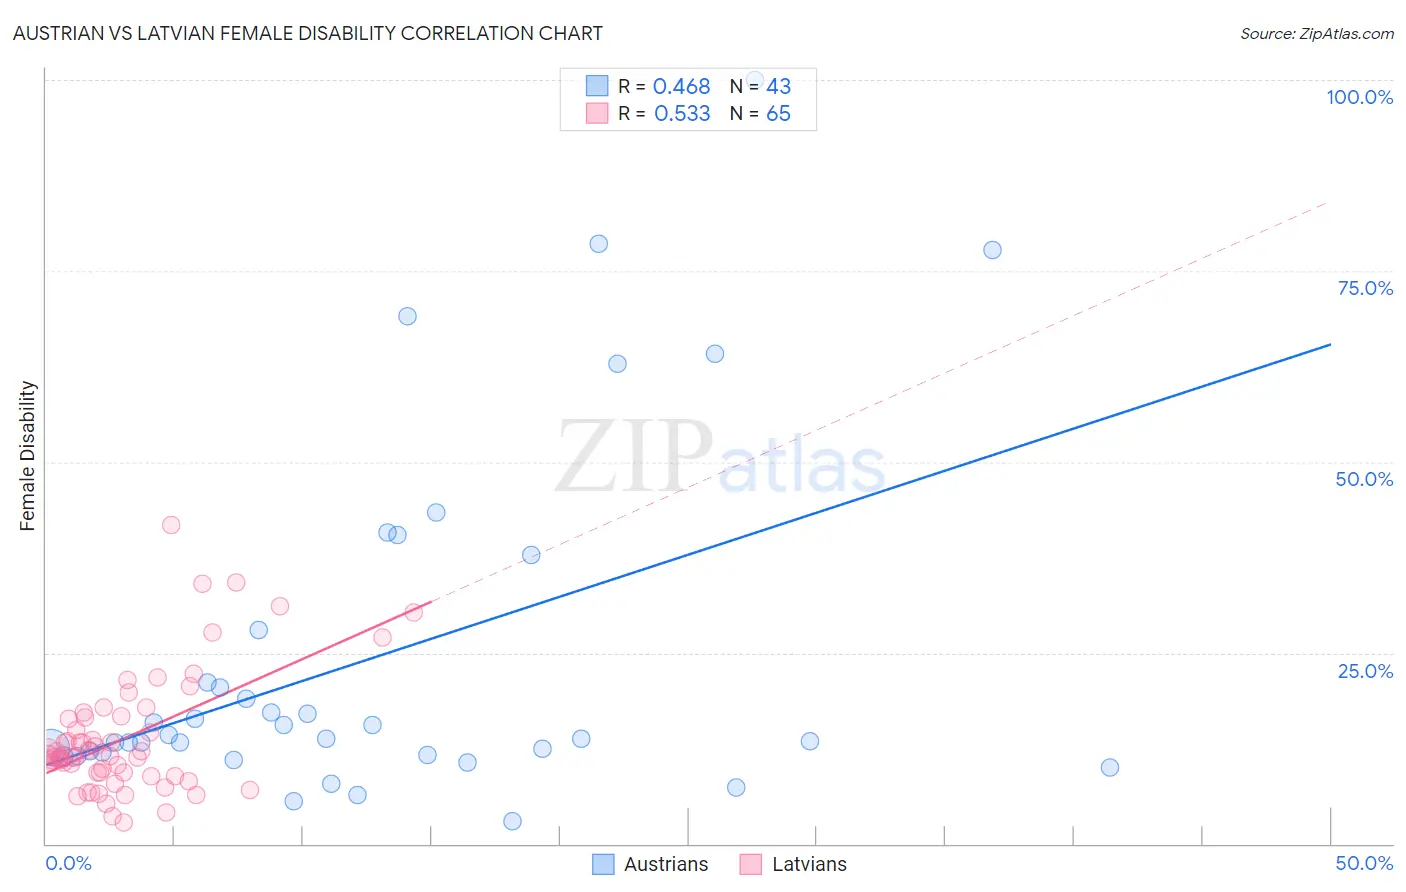
Austrian vs Latvian Female Disability Correlation Chart
The statistical analysis conducted on geographies consisting of 452,021,932 people shows a moderate positive correlation between the proportion of Austrians and percentage of females with a disability in the United States with a correlation coefficient (R) of 0.468 and weighted average of 12.3%. Similarly, the statistical analysis conducted on geographies consisting of 220,713,826 people shows a substantial positive correlation between the proportion of Latvians and percentage of females with a disability in the United States with a correlation coefficient (R) of 0.533 and weighted average of 11.7%, a difference of 4.6%.
Female Disability Correlation Summary
| Measurement | Austrian | Latvian |
| Minimum | 2.9% | 2.8% |
| Maximum | 100.0% | 41.7% |
| Range | 97.1% | 38.8% |
| Mean | 24.5% | 13.9% |
| Median | 13.7% | 11.4% |
| Interquartile 25% (IQ1) | 11.6% | 9.1% |
| Interquartile 75% (IQ3) | 28.0% | 16.6% |
| Interquartile Range (IQR) | 16.3% | 7.5% |
| Standard Deviation (Sample) | 23.1% | 7.9% |
| Standard Deviation (Population) | 22.8% | 7.8% |
Similar Demographics by Female Disability
Demographics Similar to Austrians by Female Disability
In terms of female disability, the demographic groups most similar to Austrians are Serbian (12.3%, a difference of 0.010%), Immigrants from Uzbekistan (12.3%, a difference of 0.020%), Immigrants from North America (12.3%, a difference of 0.020%), Immigrants from Albania (12.3%, a difference of 0.080%), and Immigrants from Honduras (12.3%, a difference of 0.090%).
| Demographics | Rating | Rank | Female Disability |
| Immigrants | Fiji | 38.2 /100 | #179 | Fair 12.3% |
| Albanians | 37.9 /100 | #180 | Fair 12.3% |
| Immigrants | Canada | 37.2 /100 | #181 | Fair 12.3% |
| Norwegians | 36.9 /100 | #182 | Fair 12.3% |
| Cubans | 36.5 /100 | #183 | Fair 12.3% |
| Iraqis | 36.0 /100 | #184 | Fair 12.3% |
| Immigrants | Uzbekistan | 33.9 /100 | #185 | Fair 12.3% |
| Austrians | 33.3 /100 | #186 | Fair 12.3% |
| Serbians | 33.1 /100 | #187 | Fair 12.3% |
| Immigrants | North America | 32.8 /100 | #188 | Fair 12.3% |
| Immigrants | Albania | 31.6 /100 | #189 | Fair 12.3% |
| Immigrants | Honduras | 31.3 /100 | #190 | Fair 12.3% |
| Armenians | 29.7 /100 | #191 | Fair 12.3% |
| Immigrants | Western Africa | 29.2 /100 | #192 | Fair 12.3% |
| Northern Europeans | 27.5 /100 | #193 | Fair 12.3% |
Demographics Similar to Latvians by Female Disability
In terms of female disability, the demographic groups most similar to Latvians are Immigrants from Greece (11.7%, a difference of 0.020%), New Zealander (11.7%, a difference of 0.020%), Australian (11.7%, a difference of 0.050%), Immigrants (11.7%, a difference of 0.050%), and Soviet Union (11.7%, a difference of 0.050%).
| Demographics | Rating | Rank | Female Disability |
| Immigrants | Uruguay | 98.5 /100 | #100 | Exceptional 11.7% |
| Immigrants | Costa Rica | 98.4 /100 | #101 | Exceptional 11.7% |
| Immigrants | South Eastern Asia | 98.4 /100 | #102 | Exceptional 11.7% |
| Immigrants | Eastern Africa | 98.3 /100 | #103 | Exceptional 11.7% |
| Immigrants | Western Asia | 98.3 /100 | #104 | Exceptional 11.7% |
| Australians | 98.3 /100 | #105 | Exceptional 11.7% |
| Immigrants | Greece | 98.2 /100 | #106 | Exceptional 11.7% |
| Latvians | 98.2 /100 | #107 | Exceptional 11.7% |
| New Zealanders | 98.1 /100 | #108 | Exceptional 11.7% |
| Immigrants | Immigrants | 98.1 /100 | #109 | Exceptional 11.7% |
| Soviet Union | 98.1 /100 | #110 | Exceptional 11.7% |
| Costa Ricans | 98.1 /100 | #111 | Exceptional 11.7% |
| Immigrants | Bangladesh | 97.8 /100 | #112 | Exceptional 11.8% |
| Immigrants | Belarus | 97.8 /100 | #113 | Exceptional 11.8% |
| South Africans | 97.7 /100 | #114 | Exceptional 11.8% |