Asian vs Puget Sound Salish Associate's Degree
COMPARE
Asian
Puget Sound Salish
Associate's Degree
Associate's Degree Comparison
Asians
Puget Sound Salish
52.1%
ASSOCIATE'S DEGREE
99.9/ 100
METRIC RATING
50th/ 347
METRIC RANK
40.5%
ASSOCIATE'S DEGREE
0.1/ 100
METRIC RATING
273rd/ 347
METRIC RANK
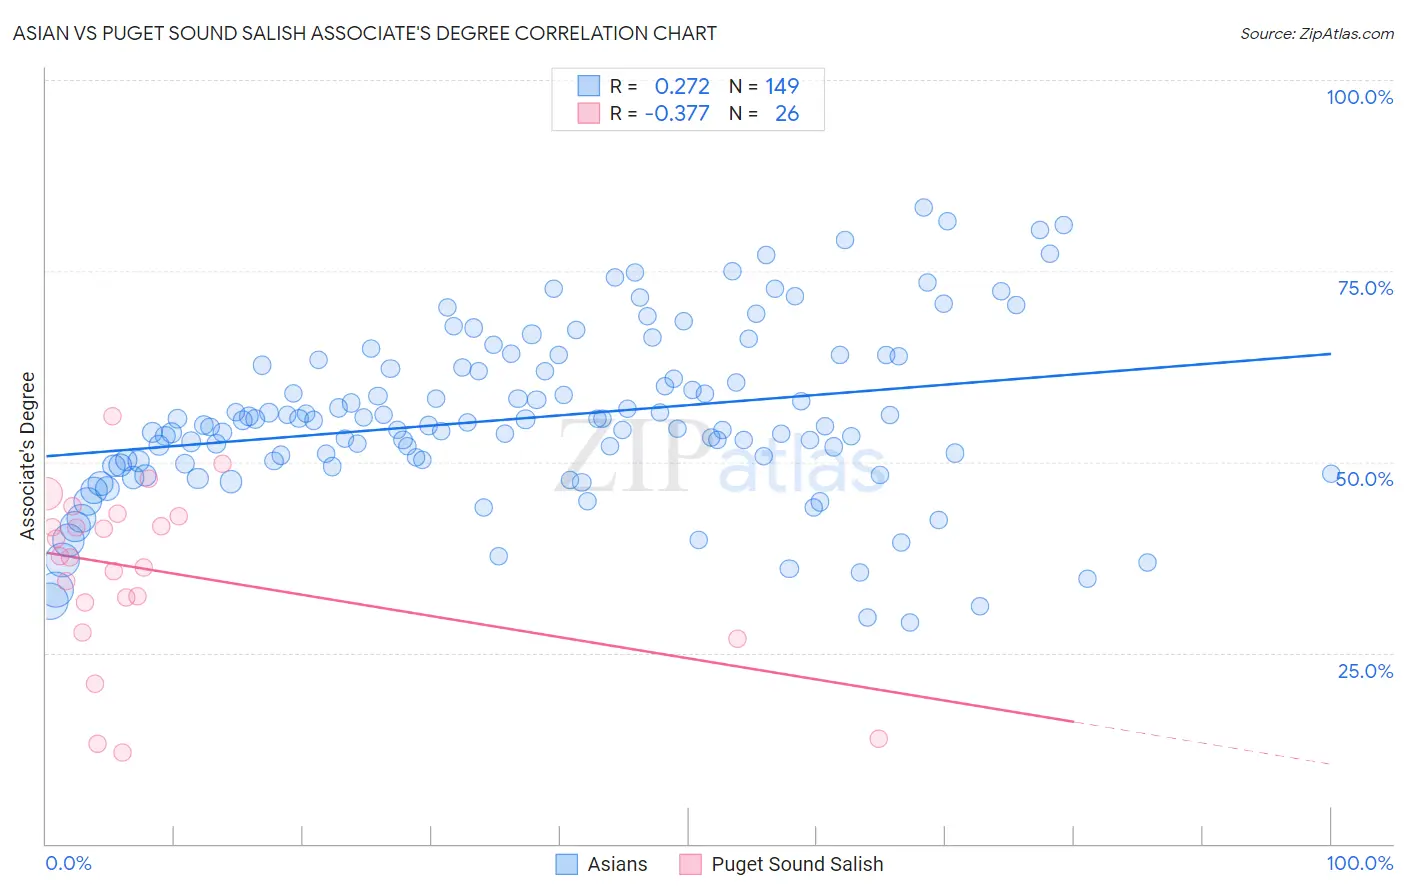
Asian vs Puget Sound Salish Associate's Degree Correlation Chart
The statistical analysis conducted on geographies consisting of 550,834,644 people shows a weak positive correlation between the proportion of Asians and percentage of population with at least associate's degree education in the United States with a correlation coefficient (R) of 0.272 and weighted average of 52.1%. Similarly, the statistical analysis conducted on geographies consisting of 46,155,865 people shows a mild negative correlation between the proportion of Puget Sound Salish and percentage of population with at least associate's degree education in the United States with a correlation coefficient (R) of -0.377 and weighted average of 40.5%, a difference of 28.6%.
Associate's Degree Correlation Summary
| Measurement | Asian | Puget Sound Salish |
| Minimum | 29.0% | 11.9% |
| Maximum | 83.3% | 56.0% |
| Range | 54.3% | 44.1% |
| Mean | 55.8% | 35.7% |
| Median | 54.8% | 37.6% |
| Interquartile 25% (IQ1) | 49.9% | 31.6% |
| Interquartile 75% (IQ3) | 62.5% | 42.9% |
| Interquartile Range (IQR) | 12.6% | 11.2% |
| Standard Deviation (Sample) | 11.1% | 11.2% |
| Standard Deviation (Population) | 11.1% | 11.0% |
Similar Demographics by Associate's Degree
Demographics Similar to Asians by Associate's Degree
In terms of associate's degree, the demographic groups most similar to Asians are Immigrants from Austria (52.1%, a difference of 0.010%), Immigrants from Greece (52.1%, a difference of 0.080%), Immigrants from Norway (52.2%, a difference of 0.21%), Bolivian (52.0%, a difference of 0.29%), and Immigrants from Asia (52.0%, a difference of 0.31%).
| Demographics | Rating | Rank | Associate's Degree |
| Immigrants | South Africa | 99.9 /100 | #43 | Exceptional 52.5% |
| Estonians | 99.9 /100 | #44 | Exceptional 52.5% |
| Immigrants | Lithuania | 99.9 /100 | #45 | Exceptional 52.4% |
| Immigrants | Bulgaria | 99.9 /100 | #46 | Exceptional 52.4% |
| Immigrants | Kuwait | 99.9 /100 | #47 | Exceptional 52.4% |
| Immigrants | Norway | 99.9 /100 | #48 | Exceptional 52.2% |
| Immigrants | Austria | 99.9 /100 | #49 | Exceptional 52.1% |
| Asians | 99.9 /100 | #50 | Exceptional 52.1% |
| Immigrants | Greece | 99.9 /100 | #51 | Exceptional 52.1% |
| Bolivians | 99.8 /100 | #52 | Exceptional 52.0% |
| Immigrants | Asia | 99.8 /100 | #53 | Exceptional 52.0% |
| Immigrants | Spain | 99.8 /100 | #54 | Exceptional 51.9% |
| Australians | 99.8 /100 | #55 | Exceptional 51.9% |
| Immigrants | Czechoslovakia | 99.8 /100 | #56 | Exceptional 51.9% |
| Paraguayans | 99.8 /100 | #57 | Exceptional 51.8% |
Demographics Similar to Puget Sound Salish by Associate's Degree
In terms of associate's degree, the demographic groups most similar to Puget Sound Salish are Immigrants from Dominica (40.5%, a difference of 0.14%), Potawatomi (40.4%, a difference of 0.28%), Belizean (40.6%, a difference of 0.29%), Immigrants from Laos (40.7%, a difference of 0.36%), and Puerto Rican (40.4%, a difference of 0.38%).
| Demographics | Rating | Rank | Associate's Degree |
| Samoans | 0.2 /100 | #266 | Tragic 41.1% |
| Hawaiians | 0.2 /100 | #267 | Tragic 40.9% |
| Central American Indians | 0.2 /100 | #268 | Tragic 40.8% |
| Americans | 0.2 /100 | #269 | Tragic 40.8% |
| Chippewa | 0.2 /100 | #270 | Tragic 40.7% |
| Immigrants | Laos | 0.1 /100 | #271 | Tragic 40.7% |
| Belizeans | 0.1 /100 | #272 | Tragic 40.6% |
| Puget Sound Salish | 0.1 /100 | #273 | Tragic 40.5% |
| Immigrants | Dominica | 0.1 /100 | #274 | Tragic 40.5% |
| Potawatomi | 0.1 /100 | #275 | Tragic 40.4% |
| Puerto Ricans | 0.1 /100 | #276 | Tragic 40.4% |
| Blackfeet | 0.1 /100 | #277 | Tragic 40.3% |
| Ottawa | 0.1 /100 | #278 | Tragic 40.3% |
| Immigrants | Nicaragua | 0.1 /100 | #279 | Tragic 40.3% |
| Immigrants | Micronesia | 0.1 /100 | #280 | Tragic 40.2% |