Asian vs Immigrants from Ethiopia Associate's Degree
COMPARE
Asian
Immigrants from Ethiopia
Associate's Degree
Associate's Degree Comparison
Asians
Immigrants from Ethiopia
52.1%
ASSOCIATE'S DEGREE
99.9/ 100
METRIC RATING
50th/ 347
METRIC RANK
50.1%
ASSOCIATE'S DEGREE
98.7/ 100
METRIC RATING
90th/ 347
METRIC RANK
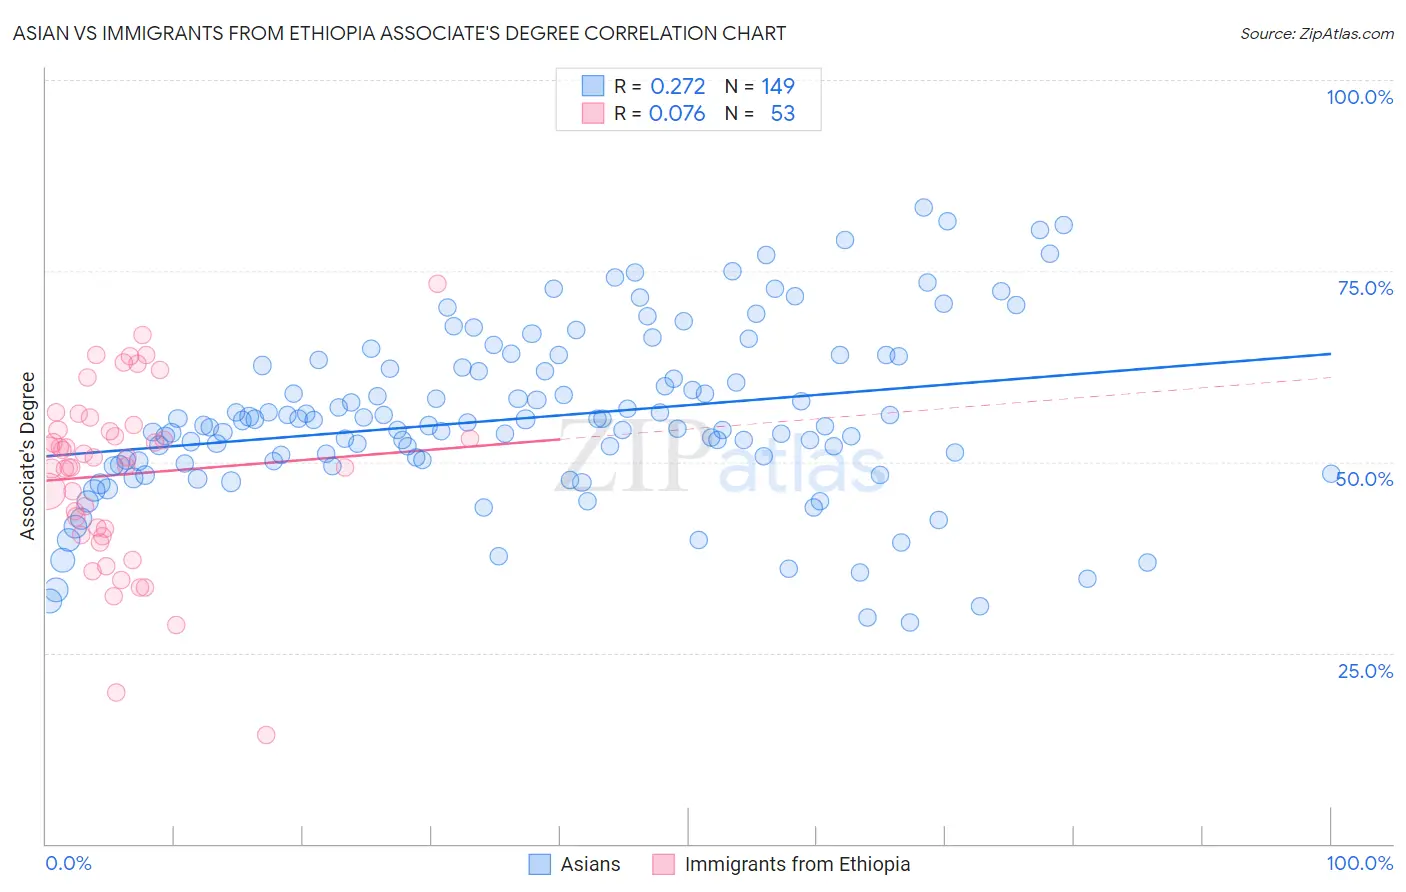
Asian vs Immigrants from Ethiopia Associate's Degree Correlation Chart
The statistical analysis conducted on geographies consisting of 550,834,644 people shows a weak positive correlation between the proportion of Asians and percentage of population with at least associate's degree education in the United States with a correlation coefficient (R) of 0.272 and weighted average of 52.1%. Similarly, the statistical analysis conducted on geographies consisting of 211,548,755 people shows a slight positive correlation between the proportion of Immigrants from Ethiopia and percentage of population with at least associate's degree education in the United States with a correlation coefficient (R) of 0.076 and weighted average of 50.1%, a difference of 4.0%.
Associate's Degree Correlation Summary
| Measurement | Asian | Immigrants from Ethiopia |
| Minimum | 29.0% | 14.3% |
| Maximum | 83.3% | 73.3% |
| Range | 54.3% | 59.0% |
| Mean | 55.8% | 48.3% |
| Median | 54.8% | 50.5% |
| Interquartile 25% (IQ1) | 49.9% | 40.9% |
| Interquartile 75% (IQ3) | 62.5% | 54.5% |
| Interquartile Range (IQR) | 12.6% | 13.7% |
| Standard Deviation (Sample) | 11.1% | 11.6% |
| Standard Deviation (Population) | 11.1% | 11.5% |
Similar Demographics by Associate's Degree
Demographics Similar to Asians by Associate's Degree
In terms of associate's degree, the demographic groups most similar to Asians are Immigrants from Austria (52.1%, a difference of 0.010%), Immigrants from Greece (52.1%, a difference of 0.080%), Immigrants from Norway (52.2%, a difference of 0.21%), Bolivian (52.0%, a difference of 0.29%), and Immigrants from Asia (52.0%, a difference of 0.31%).
| Demographics | Rating | Rank | Associate's Degree |
| Immigrants | South Africa | 99.9 /100 | #43 | Exceptional 52.5% |
| Estonians | 99.9 /100 | #44 | Exceptional 52.5% |
| Immigrants | Lithuania | 99.9 /100 | #45 | Exceptional 52.4% |
| Immigrants | Bulgaria | 99.9 /100 | #46 | Exceptional 52.4% |
| Immigrants | Kuwait | 99.9 /100 | #47 | Exceptional 52.4% |
| Immigrants | Norway | 99.9 /100 | #48 | Exceptional 52.2% |
| Immigrants | Austria | 99.9 /100 | #49 | Exceptional 52.1% |
| Asians | 99.9 /100 | #50 | Exceptional 52.1% |
| Immigrants | Greece | 99.9 /100 | #51 | Exceptional 52.1% |
| Bolivians | 99.8 /100 | #52 | Exceptional 52.0% |
| Immigrants | Asia | 99.8 /100 | #53 | Exceptional 52.0% |
| Immigrants | Spain | 99.8 /100 | #54 | Exceptional 51.9% |
| Australians | 99.8 /100 | #55 | Exceptional 51.9% |
| Immigrants | Czechoslovakia | 99.8 /100 | #56 | Exceptional 51.9% |
| Paraguayans | 99.8 /100 | #57 | Exceptional 51.8% |
Demographics Similar to Immigrants from Ethiopia by Associate's Degree
In terms of associate's degree, the demographic groups most similar to Immigrants from Ethiopia are Immigrants from Canada (50.1%, a difference of 0.010%), Immigrants from Western Europe (50.1%, a difference of 0.010%), Immigrants from Moldova (50.2%, a difference of 0.080%), Immigrants from Western Asia (50.1%, a difference of 0.080%), and Immigrants from North America (50.1%, a difference of 0.10%).
| Demographics | Rating | Rank | Associate's Degree |
| Immigrants | Uzbekistan | 98.9 /100 | #83 | Exceptional 50.3% |
| Immigrants | Hungary | 98.9 /100 | #84 | Exceptional 50.2% |
| Immigrants | Egypt | 98.9 /100 | #85 | Exceptional 50.2% |
| Immigrants | Croatia | 98.9 /100 | #86 | Exceptional 50.2% |
| Immigrants | Moldova | 98.8 /100 | #87 | Exceptional 50.2% |
| Immigrants | Canada | 98.7 /100 | #88 | Exceptional 50.1% |
| Immigrants | Western Europe | 98.7 /100 | #89 | Exceptional 50.1% |
| Immigrants | Ethiopia | 98.7 /100 | #90 | Exceptional 50.1% |
| Immigrants | Western Asia | 98.7 /100 | #91 | Exceptional 50.1% |
| Immigrants | North America | 98.7 /100 | #92 | Exceptional 50.1% |
| Immigrants | Brazil | 98.5 /100 | #93 | Exceptional 50.0% |
| Laotians | 98.4 /100 | #94 | Exceptional 49.9% |
| Immigrants | England | 98.0 /100 | #95 | Exceptional 49.7% |
| Romanians | 98.0 /100 | #96 | Exceptional 49.7% |
| Immigrants | Ukraine | 98.0 /100 | #97 | Exceptional 49.7% |