Cherokee vs Puget Sound Salish Associate's Degree
COMPARE
Cherokee
Puget Sound Salish
Associate's Degree
Associate's Degree Comparison
Cherokee
Puget Sound Salish
38.9%
ASSOCIATE'S DEGREE
0.0/ 100
METRIC RATING
296th/ 347
METRIC RANK
40.5%
ASSOCIATE'S DEGREE
0.1/ 100
METRIC RATING
273rd/ 347
METRIC RANK
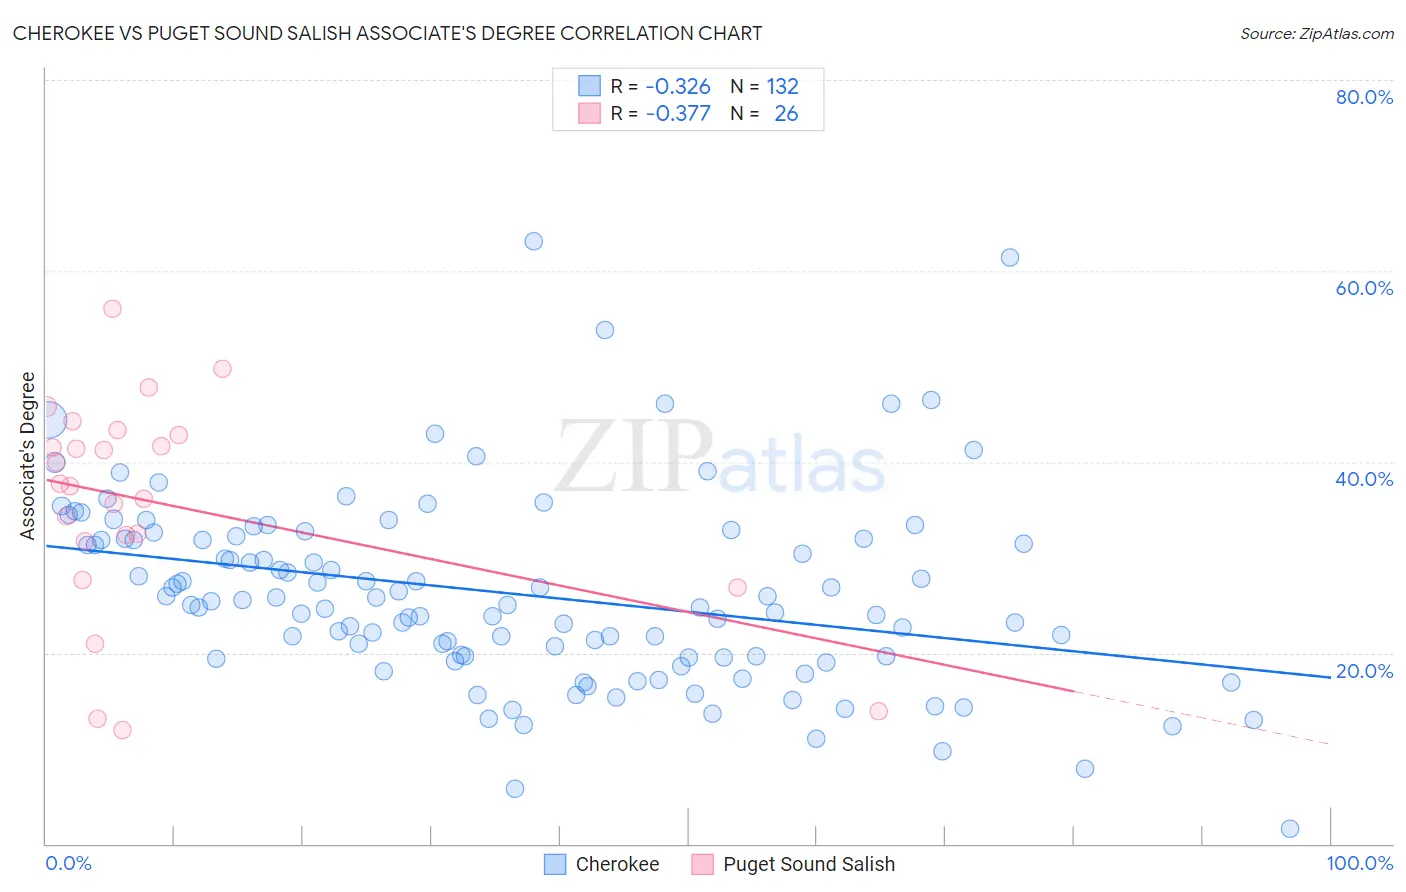
Cherokee vs Puget Sound Salish Associate's Degree Correlation Chart
The statistical analysis conducted on geographies consisting of 493,690,336 people shows a mild negative correlation between the proportion of Cherokee and percentage of population with at least associate's degree education in the United States with a correlation coefficient (R) of -0.326 and weighted average of 38.9%. Similarly, the statistical analysis conducted on geographies consisting of 46,155,865 people shows a mild negative correlation between the proportion of Puget Sound Salish and percentage of population with at least associate's degree education in the United States with a correlation coefficient (R) of -0.377 and weighted average of 40.5%, a difference of 4.2%.
Associate's Degree Correlation Summary
| Measurement | Cherokee | Puget Sound Salish |
| Minimum | 1.6% | 11.9% |
| Maximum | 63.1% | 56.0% |
| Range | 61.4% | 44.1% |
| Mean | 26.2% | 35.7% |
| Median | 25.3% | 37.6% |
| Interquartile 25% (IQ1) | 19.6% | 31.6% |
| Interquartile 75% (IQ3) | 31.9% | 42.9% |
| Interquartile Range (IQR) | 12.3% | 11.2% |
| Standard Deviation (Sample) | 10.0% | 11.2% |
| Standard Deviation (Population) | 10.0% | 11.0% |
Similar Demographics by Associate's Degree
Demographics Similar to Cherokee by Associate's Degree
In terms of associate's degree, the demographic groups most similar to Cherokee are Honduran (38.9%, a difference of 0.17%), Cape Verdean (38.8%, a difference of 0.28%), Nepalese (39.0%, a difference of 0.46%), Salvadoran (39.0%, a difference of 0.46%), and Cheyenne (38.7%, a difference of 0.55%).
| Demographics | Rating | Rank | Associate's Degree |
| Central Americans | 0.0 /100 | #289 | Tragic 39.4% |
| Immigrants | Haiti | 0.0 /100 | #290 | Tragic 39.3% |
| Dominicans | 0.0 /100 | #291 | Tragic 39.3% |
| Blacks/African Americans | 0.0 /100 | #292 | Tragic 39.1% |
| Nepalese | 0.0 /100 | #293 | Tragic 39.0% |
| Salvadorans | 0.0 /100 | #294 | Tragic 39.0% |
| Hondurans | 0.0 /100 | #295 | Tragic 38.9% |
| Cherokee | 0.0 /100 | #296 | Tragic 38.9% |
| Cape Verdeans | 0.0 /100 | #297 | Tragic 38.8% |
| Cheyenne | 0.0 /100 | #298 | Tragic 38.7% |
| Ute | 0.0 /100 | #299 | Tragic 38.6% |
| Chickasaw | 0.0 /100 | #300 | Tragic 38.6% |
| Tsimshian | 0.0 /100 | #301 | Tragic 38.6% |
| Colville | 0.0 /100 | #302 | Tragic 38.5% |
| Guatemalans | 0.0 /100 | #303 | Tragic 38.5% |
Demographics Similar to Puget Sound Salish by Associate's Degree
In terms of associate's degree, the demographic groups most similar to Puget Sound Salish are Immigrants from Dominica (40.5%, a difference of 0.14%), Potawatomi (40.4%, a difference of 0.28%), Belizean (40.6%, a difference of 0.29%), Immigrants from Laos (40.7%, a difference of 0.36%), and Puerto Rican (40.4%, a difference of 0.38%).
| Demographics | Rating | Rank | Associate's Degree |
| Samoans | 0.2 /100 | #266 | Tragic 41.1% |
| Hawaiians | 0.2 /100 | #267 | Tragic 40.9% |
| Central American Indians | 0.2 /100 | #268 | Tragic 40.8% |
| Americans | 0.2 /100 | #269 | Tragic 40.8% |
| Chippewa | 0.2 /100 | #270 | Tragic 40.7% |
| Immigrants | Laos | 0.1 /100 | #271 | Tragic 40.7% |
| Belizeans | 0.1 /100 | #272 | Tragic 40.6% |
| Puget Sound Salish | 0.1 /100 | #273 | Tragic 40.5% |
| Immigrants | Dominica | 0.1 /100 | #274 | Tragic 40.5% |
| Potawatomi | 0.1 /100 | #275 | Tragic 40.4% |
| Puerto Ricans | 0.1 /100 | #276 | Tragic 40.4% |
| Blackfeet | 0.1 /100 | #277 | Tragic 40.3% |
| Ottawa | 0.1 /100 | #278 | Tragic 40.3% |
| Immigrants | Nicaragua | 0.1 /100 | #279 | Tragic 40.3% |
| Immigrants | Micronesia | 0.1 /100 | #280 | Tragic 40.2% |