Cajun vs Puget Sound Salish Associate's Degree
COMPARE
Cajun
Puget Sound Salish
Associate's Degree
Associate's Degree Comparison
Cajuns
Puget Sound Salish
37.4%
ASSOCIATE'S DEGREE
0.0/ 100
METRIC RATING
320th/ 347
METRIC RANK
40.5%
ASSOCIATE'S DEGREE
0.1/ 100
METRIC RATING
273rd/ 347
METRIC RANK
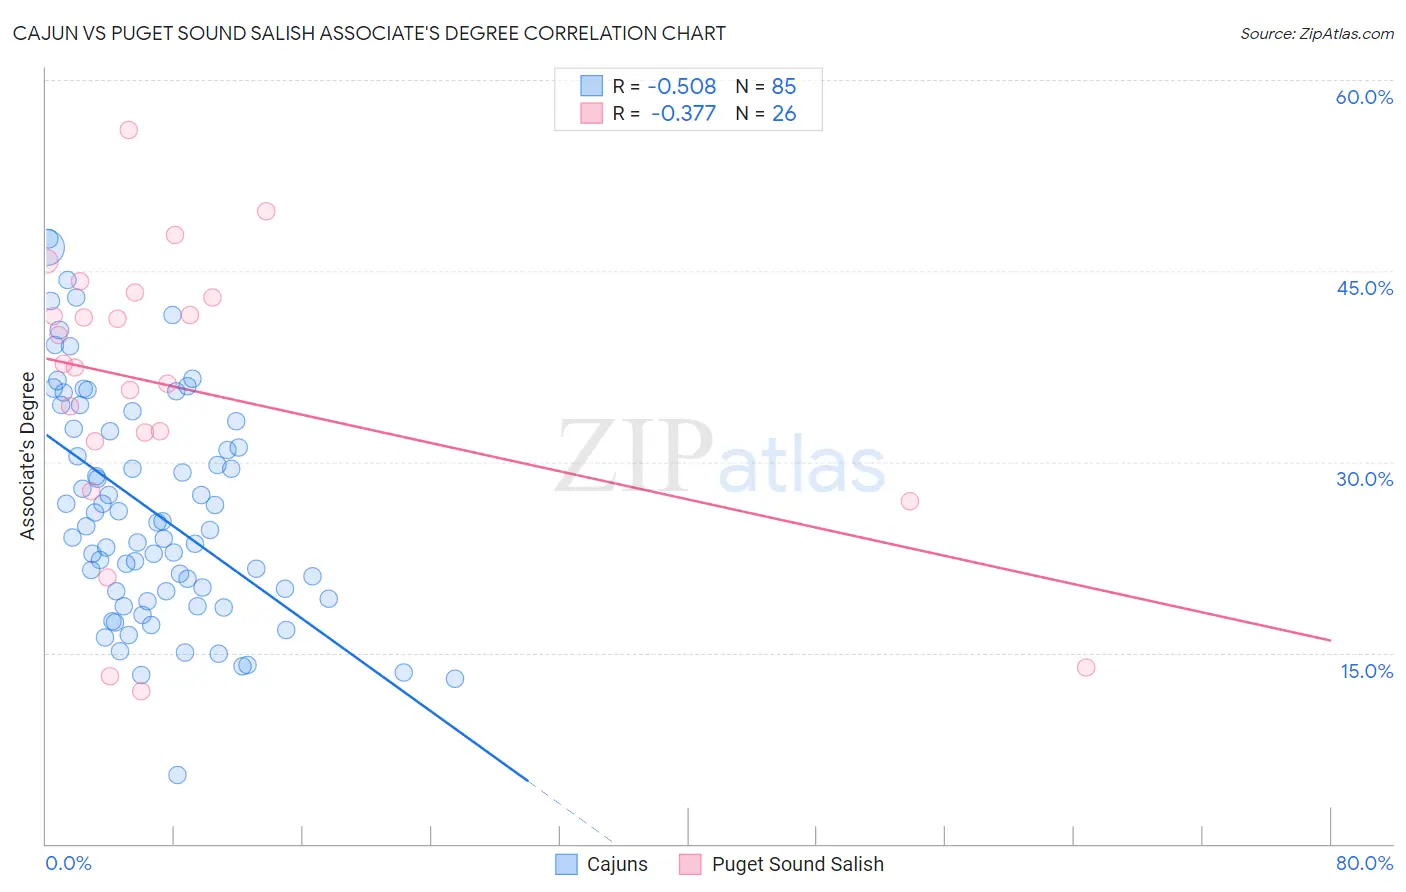
Cajun vs Puget Sound Salish Associate's Degree Correlation Chart
The statistical analysis conducted on geographies consisting of 149,710,978 people shows a substantial negative correlation between the proportion of Cajuns and percentage of population with at least associate's degree education in the United States with a correlation coefficient (R) of -0.508 and weighted average of 37.4%. Similarly, the statistical analysis conducted on geographies consisting of 46,155,865 people shows a mild negative correlation between the proportion of Puget Sound Salish and percentage of population with at least associate's degree education in the United States with a correlation coefficient (R) of -0.377 and weighted average of 40.5%, a difference of 8.4%.
Associate's Degree Correlation Summary
| Measurement | Cajun | Puget Sound Salish |
| Minimum | 5.4% | 11.9% |
| Maximum | 47.6% | 56.0% |
| Range | 42.2% | 44.1% |
| Mean | 26.2% | 35.7% |
| Median | 24.9% | 37.6% |
| Interquartile 25% (IQ1) | 19.5% | 31.6% |
| Interquartile 75% (IQ3) | 32.9% | 42.9% |
| Interquartile Range (IQR) | 13.4% | 11.2% |
| Standard Deviation (Sample) | 8.9% | 11.2% |
| Standard Deviation (Population) | 8.8% | 11.0% |
Similar Demographics by Associate's Degree
Demographics Similar to Cajuns by Associate's Degree
In terms of associate's degree, the demographic groups most similar to Cajuns are Fijian (37.4%, a difference of 0.030%), Immigrants from Yemen (37.3%, a difference of 0.12%), Alaska Native (37.5%, a difference of 0.25%), Pennsylvania German (37.2%, a difference of 0.40%), and Yaqui (37.6%, a difference of 0.48%).
| Demographics | Rating | Rank | Associate's Degree |
| Hispanics or Latinos | 0.0 /100 | #313 | Tragic 37.7% |
| Seminole | 0.0 /100 | #314 | Tragic 37.7% |
| Creek | 0.0 /100 | #315 | Tragic 37.6% |
| Crow | 0.0 /100 | #316 | Tragic 37.6% |
| Yaqui | 0.0 /100 | #317 | Tragic 37.6% |
| Alaska Natives | 0.0 /100 | #318 | Tragic 37.5% |
| Fijians | 0.0 /100 | #319 | Tragic 37.4% |
| Cajuns | 0.0 /100 | #320 | Tragic 37.4% |
| Immigrants | Yemen | 0.0 /100 | #321 | Tragic 37.3% |
| Pennsylvania Germans | 0.0 /100 | #322 | Tragic 37.2% |
| Immigrants | Cabo Verde | 0.0 /100 | #323 | Tragic 36.8% |
| Arapaho | 0.0 /100 | #324 | Tragic 36.7% |
| Menominee | 0.0 /100 | #325 | Tragic 36.7% |
| Kiowa | 0.0 /100 | #326 | Tragic 36.5% |
| Dutch West Indians | 0.0 /100 | #327 | Tragic 36.5% |
Demographics Similar to Puget Sound Salish by Associate's Degree
In terms of associate's degree, the demographic groups most similar to Puget Sound Salish are Immigrants from Dominica (40.5%, a difference of 0.14%), Potawatomi (40.4%, a difference of 0.28%), Belizean (40.6%, a difference of 0.29%), Immigrants from Laos (40.7%, a difference of 0.36%), and Puerto Rican (40.4%, a difference of 0.38%).
| Demographics | Rating | Rank | Associate's Degree |
| Samoans | 0.2 /100 | #266 | Tragic 41.1% |
| Hawaiians | 0.2 /100 | #267 | Tragic 40.9% |
| Central American Indians | 0.2 /100 | #268 | Tragic 40.8% |
| Americans | 0.2 /100 | #269 | Tragic 40.8% |
| Chippewa | 0.2 /100 | #270 | Tragic 40.7% |
| Immigrants | Laos | 0.1 /100 | #271 | Tragic 40.7% |
| Belizeans | 0.1 /100 | #272 | Tragic 40.6% |
| Puget Sound Salish | 0.1 /100 | #273 | Tragic 40.5% |
| Immigrants | Dominica | 0.1 /100 | #274 | Tragic 40.5% |
| Potawatomi | 0.1 /100 | #275 | Tragic 40.4% |
| Puerto Ricans | 0.1 /100 | #276 | Tragic 40.4% |
| Blackfeet | 0.1 /100 | #277 | Tragic 40.3% |
| Ottawa | 0.1 /100 | #278 | Tragic 40.3% |
| Immigrants | Nicaragua | 0.1 /100 | #279 | Tragic 40.3% |
| Immigrants | Micronesia | 0.1 /100 | #280 | Tragic 40.2% |