South American vs Puget Sound Salish Associate's Degree
COMPARE
South American
Puget Sound Salish
Associate's Degree
Associate's Degree Comparison
South Americans
Puget Sound Salish
47.1%
ASSOCIATE'S DEGREE
70.5/ 100
METRIC RATING
156th/ 347
METRIC RANK
40.5%
ASSOCIATE'S DEGREE
0.1/ 100
METRIC RATING
273rd/ 347
METRIC RANK
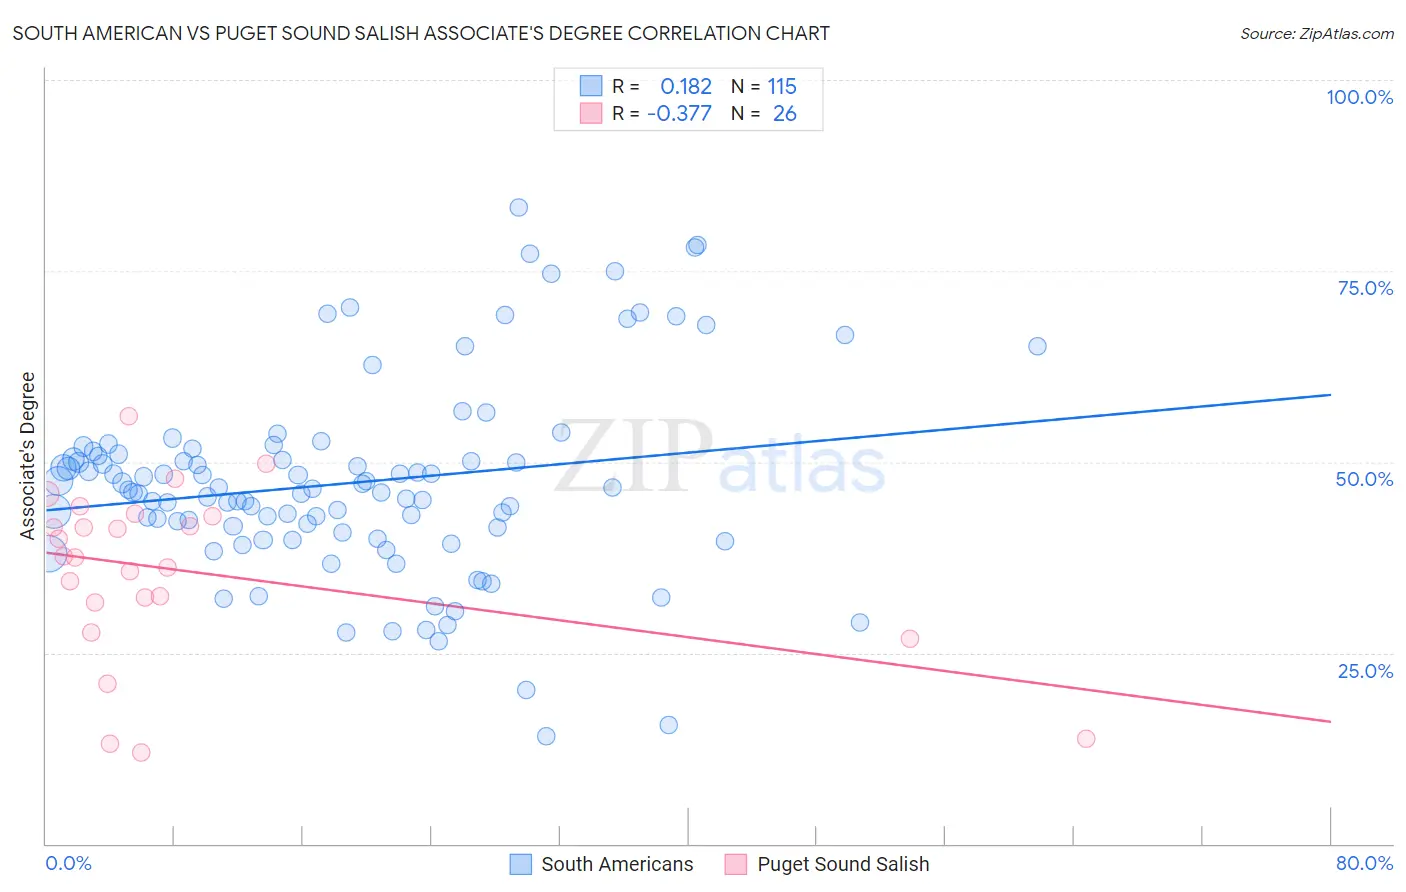
South American vs Puget Sound Salish Associate's Degree Correlation Chart
The statistical analysis conducted on geographies consisting of 494,120,152 people shows a poor positive correlation between the proportion of South Americans and percentage of population with at least associate's degree education in the United States with a correlation coefficient (R) of 0.182 and weighted average of 47.1%. Similarly, the statistical analysis conducted on geographies consisting of 46,155,865 people shows a mild negative correlation between the proportion of Puget Sound Salish and percentage of population with at least associate's degree education in the United States with a correlation coefficient (R) of -0.377 and weighted average of 40.5%, a difference of 16.3%.
Associate's Degree Correlation Summary
| Measurement | South American | Puget Sound Salish |
| Minimum | 14.1% | 11.9% |
| Maximum | 83.4% | 56.0% |
| Range | 69.2% | 44.1% |
| Mean | 47.2% | 35.7% |
| Median | 46.3% | 37.6% |
| Interquartile 25% (IQ1) | 40.8% | 31.6% |
| Interquartile 75% (IQ3) | 51.0% | 42.9% |
| Interquartile Range (IQR) | 10.2% | 11.2% |
| Standard Deviation (Sample) | 12.9% | 11.2% |
| Standard Deviation (Population) | 12.8% | 11.0% |
Similar Demographics by Associate's Degree
Demographics Similar to South Americans by Associate's Degree
In terms of associate's degree, the demographic groups most similar to South Americans are Kenyan (47.1%, a difference of 0.010%), Sudanese (47.1%, a difference of 0.020%), Immigrants from Germany (47.1%, a difference of 0.070%), Immigrants from Poland (47.1%, a difference of 0.12%), and Immigrants from Kenya (47.2%, a difference of 0.14%).
| Demographics | Rating | Rank | Associate's Degree |
| Immigrants | Armenia | 76.6 /100 | #149 | Good 47.4% |
| Iraqis | 76.2 /100 | #150 | Good 47.4% |
| Immigrants | North Macedonia | 76.0 /100 | #151 | Good 47.4% |
| Immigrants | Afghanistan | 74.3 /100 | #152 | Good 47.3% |
| Czechs | 72.2 /100 | #153 | Good 47.2% |
| Immigrants | Kenya | 72.1 /100 | #154 | Good 47.2% |
| Kenyans | 70.6 /100 | #155 | Good 47.1% |
| South Americans | 70.5 /100 | #156 | Good 47.1% |
| Sudanese | 70.3 /100 | #157 | Good 47.1% |
| Immigrants | Germany | 69.7 /100 | #158 | Good 47.1% |
| Immigrants | Poland | 69.2 /100 | #159 | Good 47.1% |
| Scottish | 65.4 /100 | #160 | Good 46.9% |
| Scandinavians | 65.2 /100 | #161 | Good 46.9% |
| Immigrants | Africa | 63.2 /100 | #162 | Good 46.8% |
| Somalis | 62.5 /100 | #163 | Good 46.8% |
Demographics Similar to Puget Sound Salish by Associate's Degree
In terms of associate's degree, the demographic groups most similar to Puget Sound Salish are Immigrants from Dominica (40.5%, a difference of 0.14%), Potawatomi (40.4%, a difference of 0.28%), Belizean (40.6%, a difference of 0.29%), Immigrants from Laos (40.7%, a difference of 0.36%), and Puerto Rican (40.4%, a difference of 0.38%).
| Demographics | Rating | Rank | Associate's Degree |
| Samoans | 0.2 /100 | #266 | Tragic 41.1% |
| Hawaiians | 0.2 /100 | #267 | Tragic 40.9% |
| Central American Indians | 0.2 /100 | #268 | Tragic 40.8% |
| Americans | 0.2 /100 | #269 | Tragic 40.8% |
| Chippewa | 0.2 /100 | #270 | Tragic 40.7% |
| Immigrants | Laos | 0.1 /100 | #271 | Tragic 40.7% |
| Belizeans | 0.1 /100 | #272 | Tragic 40.6% |
| Puget Sound Salish | 0.1 /100 | #273 | Tragic 40.5% |
| Immigrants | Dominica | 0.1 /100 | #274 | Tragic 40.5% |
| Potawatomi | 0.1 /100 | #275 | Tragic 40.4% |
| Puerto Ricans | 0.1 /100 | #276 | Tragic 40.4% |
| Blackfeet | 0.1 /100 | #277 | Tragic 40.3% |
| Ottawa | 0.1 /100 | #278 | Tragic 40.3% |
| Immigrants | Nicaragua | 0.1 /100 | #279 | Tragic 40.3% |
| Immigrants | Micronesia | 0.1 /100 | #280 | Tragic 40.2% |