Sierra Leonean vs Puget Sound Salish Associate's Degree
COMPARE
Sierra Leonean
Puget Sound Salish
Associate's Degree
Associate's Degree Comparison
Sierra Leoneans
Puget Sound Salish
47.7%
ASSOCIATE'S DEGREE
82.9/ 100
METRIC RATING
142nd/ 347
METRIC RANK
40.5%
ASSOCIATE'S DEGREE
0.1/ 100
METRIC RATING
273rd/ 347
METRIC RANK
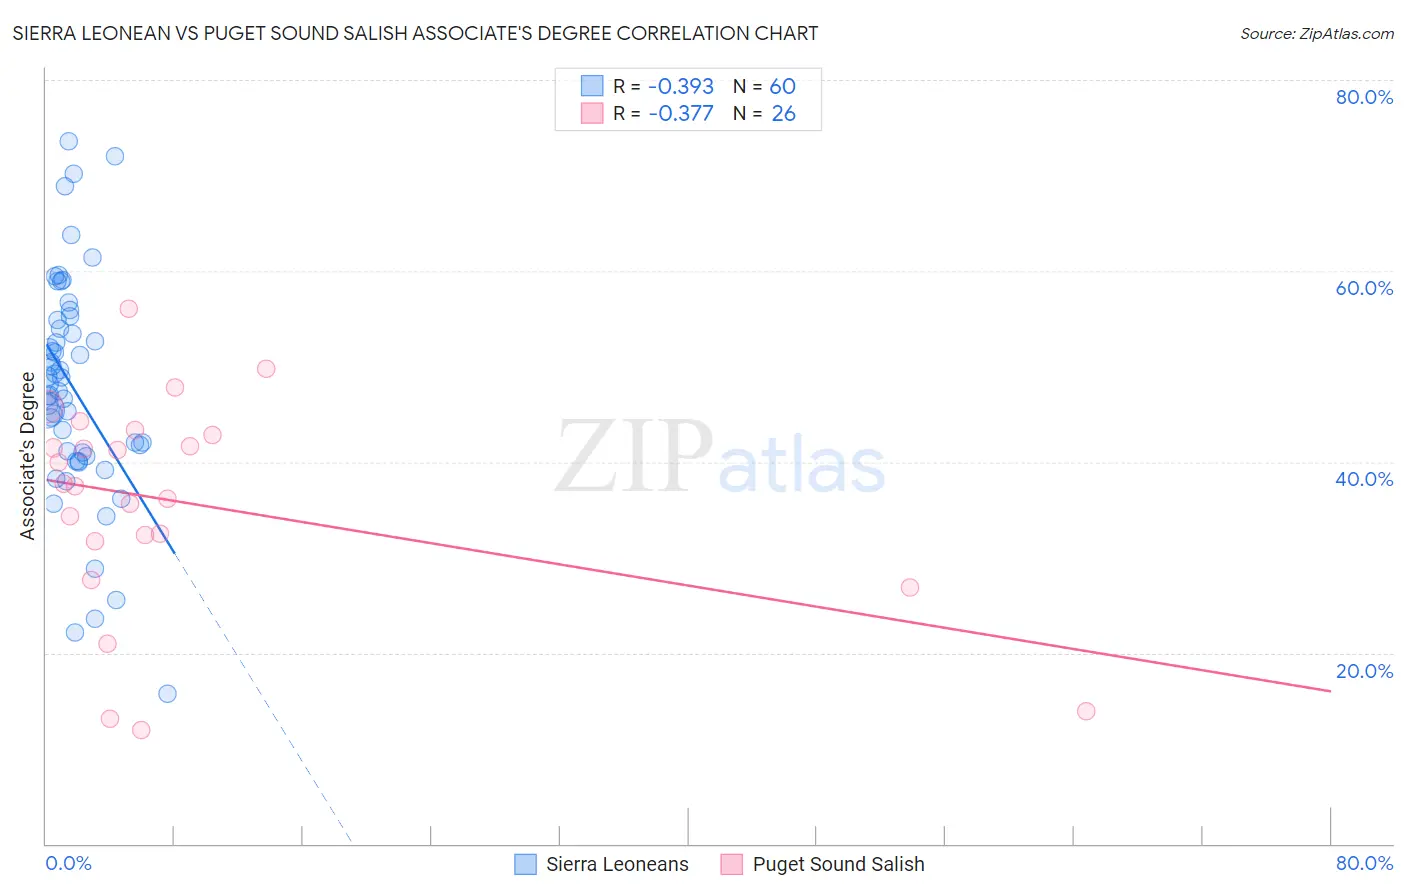
Sierra Leonean vs Puget Sound Salish Associate's Degree Correlation Chart
The statistical analysis conducted on geographies consisting of 83,364,635 people shows a mild negative correlation between the proportion of Sierra Leoneans and percentage of population with at least associate's degree education in the United States with a correlation coefficient (R) of -0.393 and weighted average of 47.7%. Similarly, the statistical analysis conducted on geographies consisting of 46,155,865 people shows a mild negative correlation between the proportion of Puget Sound Salish and percentage of population with at least associate's degree education in the United States with a correlation coefficient (R) of -0.377 and weighted average of 40.5%, a difference of 17.8%.
Associate's Degree Correlation Summary
| Measurement | Sierra Leonean | Puget Sound Salish |
| Minimum | 15.7% | 11.9% |
| Maximum | 73.5% | 56.0% |
| Range | 57.8% | 44.1% |
| Mean | 47.6% | 35.7% |
| Median | 47.8% | 37.6% |
| Interquartile 25% (IQ1) | 40.7% | 31.6% |
| Interquartile 75% (IQ3) | 54.4% | 42.9% |
| Interquartile Range (IQR) | 13.6% | 11.2% |
| Standard Deviation (Sample) | 11.7% | 11.2% |
| Standard Deviation (Population) | 11.6% | 11.0% |
Similar Demographics by Associate's Degree
Demographics Similar to Sierra Leoneans by Associate's Degree
In terms of associate's degree, the demographic groups most similar to Sierra Leoneans are Taiwanese (47.7%, a difference of 0.050%), Immigrants from Southern Europe (47.8%, a difference of 0.20%), Norwegian (47.6%, a difference of 0.23%), Slavic (47.6%, a difference of 0.29%), and Slovene (47.9%, a difference of 0.30%).
| Demographics | Rating | Rank | Associate's Degree |
| Europeans | 89.0 /100 | #135 | Excellent 48.2% |
| Pakistanis | 88.0 /100 | #136 | Excellent 48.1% |
| Immigrants | Eritrea | 87.8 /100 | #137 | Excellent 48.1% |
| Poles | 87.3 /100 | #138 | Excellent 48.0% |
| Slovenes | 85.1 /100 | #139 | Excellent 47.9% |
| Immigrants | Southern Europe | 84.4 /100 | #140 | Excellent 47.8% |
| Taiwanese | 83.3 /100 | #141 | Excellent 47.7% |
| Sierra Leoneans | 82.9 /100 | #142 | Excellent 47.7% |
| Norwegians | 81.0 /100 | #143 | Excellent 47.6% |
| Slavs | 80.5 /100 | #144 | Excellent 47.6% |
| Canadians | 79.0 /100 | #145 | Good 47.5% |
| Immigrants | Sudan | 77.9 /100 | #146 | Good 47.4% |
| Danes | 77.3 /100 | #147 | Good 47.4% |
| South American Indians | 76.7 /100 | #148 | Good 47.4% |
| Immigrants | Armenia | 76.6 /100 | #149 | Good 47.4% |
Demographics Similar to Puget Sound Salish by Associate's Degree
In terms of associate's degree, the demographic groups most similar to Puget Sound Salish are Immigrants from Dominica (40.5%, a difference of 0.14%), Potawatomi (40.4%, a difference of 0.28%), Belizean (40.6%, a difference of 0.29%), Immigrants from Laos (40.7%, a difference of 0.36%), and Puerto Rican (40.4%, a difference of 0.38%).
| Demographics | Rating | Rank | Associate's Degree |
| Samoans | 0.2 /100 | #266 | Tragic 41.1% |
| Hawaiians | 0.2 /100 | #267 | Tragic 40.9% |
| Central American Indians | 0.2 /100 | #268 | Tragic 40.8% |
| Americans | 0.2 /100 | #269 | Tragic 40.8% |
| Chippewa | 0.2 /100 | #270 | Tragic 40.7% |
| Immigrants | Laos | 0.1 /100 | #271 | Tragic 40.7% |
| Belizeans | 0.1 /100 | #272 | Tragic 40.6% |
| Puget Sound Salish | 0.1 /100 | #273 | Tragic 40.5% |
| Immigrants | Dominica | 0.1 /100 | #274 | Tragic 40.5% |
| Potawatomi | 0.1 /100 | #275 | Tragic 40.4% |
| Puerto Ricans | 0.1 /100 | #276 | Tragic 40.4% |
| Blackfeet | 0.1 /100 | #277 | Tragic 40.3% |
| Ottawa | 0.1 /100 | #278 | Tragic 40.3% |
| Immigrants | Nicaragua | 0.1 /100 | #279 | Tragic 40.3% |
| Immigrants | Micronesia | 0.1 /100 | #280 | Tragic 40.2% |