Asian vs Puget Sound Salish In Labor Force | Age 16-19
COMPARE
Asian
Puget Sound Salish
In Labor Force | Age 16-19
In Labor Force | Age 16-19 Comparison
Asians
Puget Sound Salish
34.1%
IN LABOR FORCE | AGE 16-19
0.4/ 100
METRIC RATING
272nd/ 347
METRIC RANK
39.1%
IN LABOR FORCE | AGE 16-19
99.6/ 100
METRIC RATING
88th/ 347
METRIC RANK
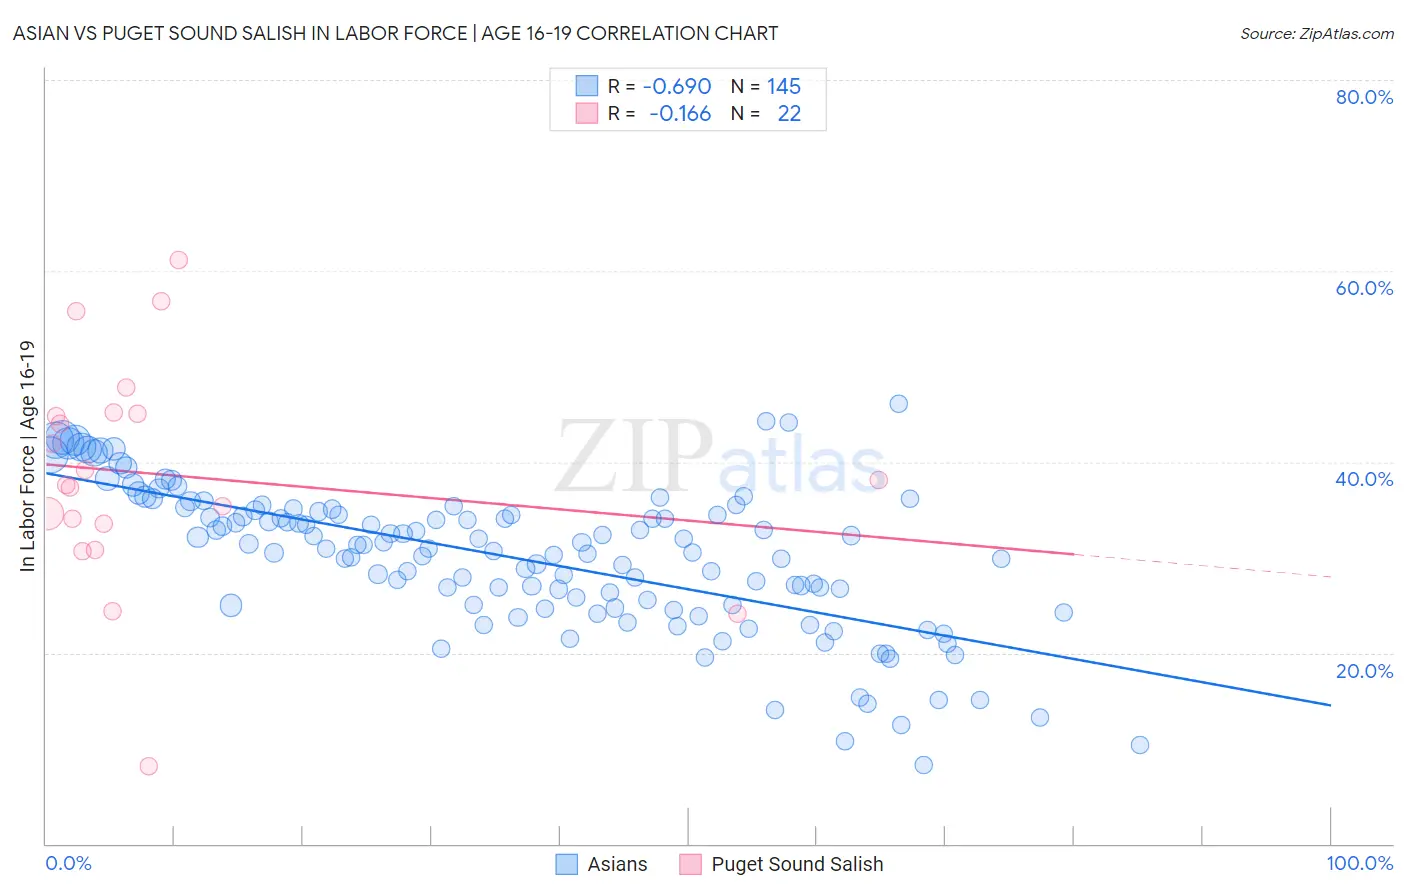
Asian vs Puget Sound Salish In Labor Force | Age 16-19 Correlation Chart
The statistical analysis conducted on geographies consisting of 548,440,716 people shows a significant negative correlation between the proportion of Asians and labor force participation rate among population between the ages 16 and 19 in the United States with a correlation coefficient (R) of -0.690 and weighted average of 34.1%. Similarly, the statistical analysis conducted on geographies consisting of 46,131,142 people shows a poor negative correlation between the proportion of Puget Sound Salish and labor force participation rate among population between the ages 16 and 19 in the United States with a correlation coefficient (R) of -0.166 and weighted average of 39.1%, a difference of 14.7%.
In Labor Force | Age 16-19 Correlation Summary
| Measurement | Asian | Puget Sound Salish |
| Minimum | 8.3% | 8.1% |
| Maximum | 46.1% | 61.2% |
| Range | 37.8% | 53.1% |
| Mean | 29.9% | 38.6% |
| Median | 30.9% | 37.8% |
| Interquartile 25% (IQ1) | 25.0% | 33.5% |
| Interquartile 75% (IQ3) | 34.9% | 45.0% |
| Interquartile Range (IQR) | 9.9% | 11.5% |
| Standard Deviation (Sample) | 7.6% | 11.8% |
| Standard Deviation (Population) | 7.6% | 11.5% |
Similar Demographics by In Labor Force | Age 16-19
Demographics Similar to Asians by In Labor Force | Age 16-19
In terms of in labor force | age 16-19, the demographic groups most similar to Asians are Immigrants from Russia (34.1%, a difference of 0.030%), Central American Indian (34.1%, a difference of 0.030%), Pima (34.1%, a difference of 0.070%), Immigrants from Asia (34.1%, a difference of 0.16%), and Immigrants from Panama (34.0%, a difference of 0.22%).
| Demographics | Rating | Rank | In Labor Force | Age 16-19 |
| Immigrants | El Salvador | 0.7 /100 | #265 | Tragic 34.3% |
| Immigrants | Malaysia | 0.7 /100 | #266 | Tragic 34.3% |
| Immigrants | Peru | 0.5 /100 | #267 | Tragic 34.2% |
| Immigrants | Asia | 0.5 /100 | #268 | Tragic 34.1% |
| Pima | 0.5 /100 | #269 | Tragic 34.1% |
| Immigrants | Russia | 0.4 /100 | #270 | Tragic 34.1% |
| Central American Indians | 0.4 /100 | #271 | Tragic 34.1% |
| Asians | 0.4 /100 | #272 | Tragic 34.1% |
| Immigrants | Panama | 0.4 /100 | #273 | Tragic 34.0% |
| Venezuelans | 0.3 /100 | #274 | Tragic 34.0% |
| Immigrants | Fiji | 0.3 /100 | #275 | Tragic 33.9% |
| Immigrants | Latin America | 0.3 /100 | #276 | Tragic 33.9% |
| Menominee | 0.3 /100 | #277 | Tragic 33.9% |
| Colombians | 0.3 /100 | #278 | Tragic 33.8% |
| Paraguayans | 0.3 /100 | #279 | Tragic 33.8% |
Demographics Similar to Puget Sound Salish by In Labor Force | Age 16-19
In terms of in labor force | age 16-19, the demographic groups most similar to Puget Sound Salish are Alaska Native (39.1%, a difference of 0.010%), Immigrants from Germany (39.1%, a difference of 0.070%), Immigrants from Burma/Myanmar (39.0%, a difference of 0.090%), Samoan (39.1%, a difference of 0.16%), and Creek (39.1%, a difference of 0.17%).
| Demographics | Rating | Rank | In Labor Force | Age 16-19 |
| Shoshone | 99.7 /100 | #81 | Exceptional 39.3% |
| Basques | 99.7 /100 | #82 | Exceptional 39.3% |
| Spanish | 99.7 /100 | #83 | Exceptional 39.3% |
| Immigrants | Uganda | 99.7 /100 | #84 | Exceptional 39.2% |
| Creek | 99.6 /100 | #85 | Exceptional 39.1% |
| Samoans | 99.6 /100 | #86 | Exceptional 39.1% |
| Immigrants | Germany | 99.6 /100 | #87 | Exceptional 39.1% |
| Puget Sound Salish | 99.6 /100 | #88 | Exceptional 39.1% |
| Alaska Natives | 99.6 /100 | #89 | Exceptional 39.1% |
| Immigrants | Burma/Myanmar | 99.5 /100 | #90 | Exceptional 39.0% |
| Spanish Americans | 99.5 /100 | #91 | Exceptional 39.0% |
| Osage | 99.4 /100 | #92 | Exceptional 39.0% |
| Blackfeet | 99.4 /100 | #93 | Exceptional 38.9% |
| Immigrants | Canada | 99.4 /100 | #94 | Exceptional 38.9% |
| Immigrants | North America | 99.4 /100 | #95 | Exceptional 38.9% |