Spanish vs Puget Sound Salish Associate's Degree
COMPARE
Spanish
Puget Sound Salish
Associate's Degree
Associate's Degree Comparison
Spanish
Puget Sound Salish
44.4%
ASSOCIATE'S DEGREE
9.4/ 100
METRIC RATING
218th/ 347
METRIC RANK
40.5%
ASSOCIATE'S DEGREE
0.1/ 100
METRIC RATING
273rd/ 347
METRIC RANK
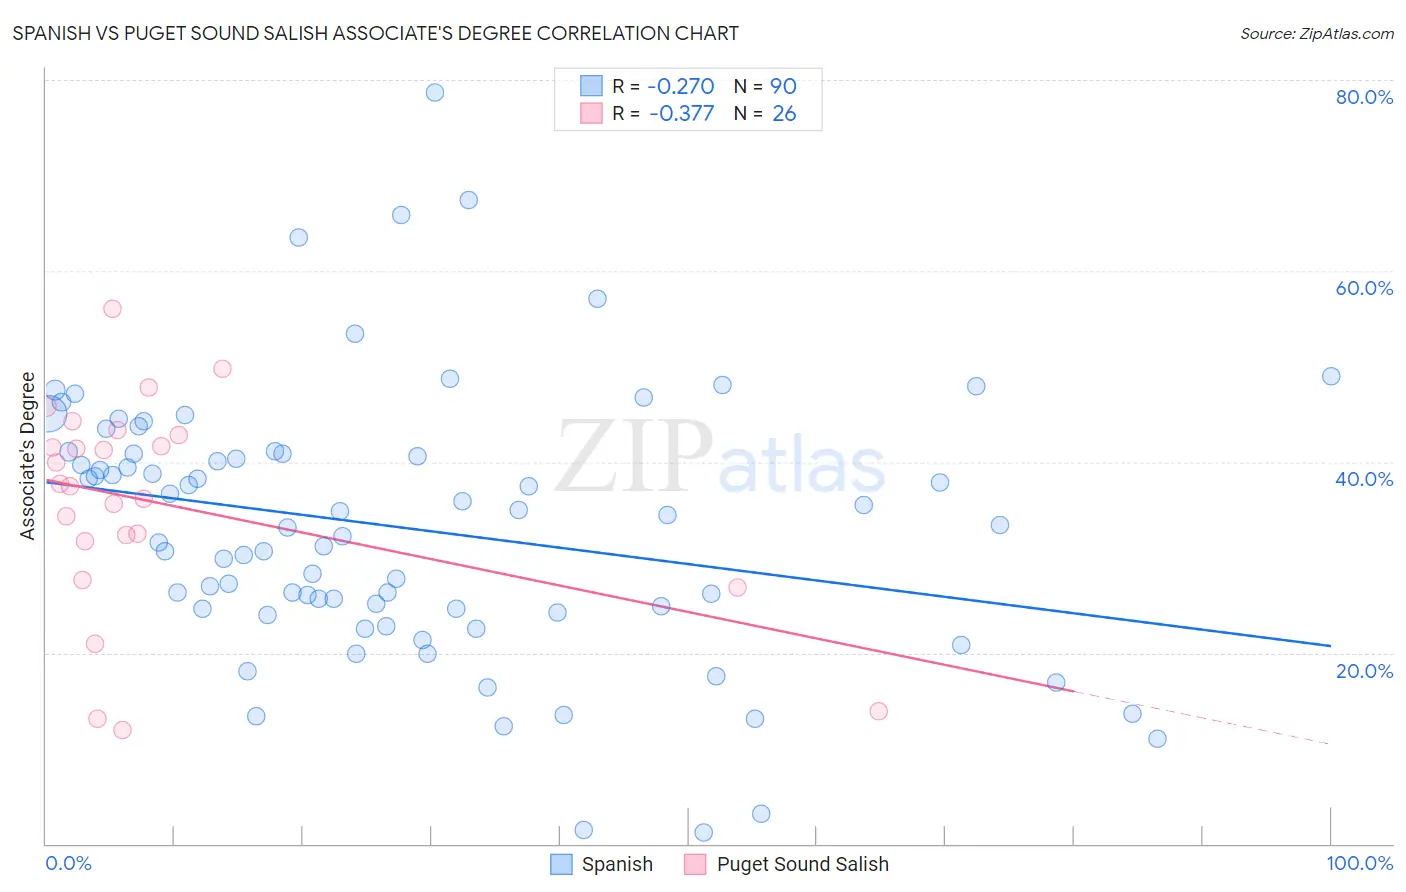
Spanish vs Puget Sound Salish Associate's Degree Correlation Chart
The statistical analysis conducted on geographies consisting of 422,178,546 people shows a weak negative correlation between the proportion of Spanish and percentage of population with at least associate's degree education in the United States with a correlation coefficient (R) of -0.270 and weighted average of 44.4%. Similarly, the statistical analysis conducted on geographies consisting of 46,155,865 people shows a mild negative correlation between the proportion of Puget Sound Salish and percentage of population with at least associate's degree education in the United States with a correlation coefficient (R) of -0.377 and weighted average of 40.5%, a difference of 9.6%.
Associate's Degree Correlation Summary
| Measurement | Spanish | Puget Sound Salish |
| Minimum | 1.2% | 11.9% |
| Maximum | 78.7% | 56.0% |
| Range | 77.5% | 44.1% |
| Mean | 33.1% | 35.7% |
| Median | 33.2% | 37.6% |
| Interquartile 25% (IQ1) | 24.7% | 31.6% |
| Interquartile 75% (IQ3) | 40.9% | 42.9% |
| Interquartile Range (IQR) | 16.2% | 11.2% |
| Standard Deviation (Sample) | 14.1% | 11.2% |
| Standard Deviation (Population) | 14.1% | 11.0% |
Similar Demographics by Associate's Degree
Demographics Similar to Spanish by Associate's Degree
In terms of associate's degree, the demographic groups most similar to Spanish are Immigrants (44.5%, a difference of 0.25%), Immigrants from Nigeria (44.6%, a difference of 0.43%), White/Caucasian (44.2%, a difference of 0.48%), Portuguese (44.1%, a difference of 0.55%), and Immigrants from Panama (44.7%, a difference of 0.61%).
| Demographics | Rating | Rank | Associate's Degree |
| Immigrants | Zaire | 16.6 /100 | #211 | Poor 45.0% |
| French Canadians | 15.0 /100 | #212 | Poor 44.9% |
| Immigrants | Ghana | 14.2 /100 | #213 | Poor 44.8% |
| Immigrants | Middle Africa | 12.7 /100 | #214 | Poor 44.7% |
| Immigrants | Panama | 12.4 /100 | #215 | Poor 44.7% |
| Immigrants | Nigeria | 11.4 /100 | #216 | Poor 44.6% |
| Immigrants | Immigrants | 10.5 /100 | #217 | Poor 44.5% |
| Spanish | 9.4 /100 | #218 | Tragic 44.4% |
| Whites/Caucasians | 7.5 /100 | #219 | Tragic 44.2% |
| Portuguese | 7.2 /100 | #220 | Tragic 44.1% |
| Immigrants | Western Africa | 6.6 /100 | #221 | Tragic 44.1% |
| Barbadians | 5.8 /100 | #222 | Tragic 43.9% |
| Sub-Saharan Africans | 5.5 /100 | #223 | Tragic 43.9% |
| West Indians | 5.2 /100 | #224 | Tragic 43.8% |
| Guamanians/Chamorros | 4.8 /100 | #225 | Tragic 43.8% |
Demographics Similar to Puget Sound Salish by Associate's Degree
In terms of associate's degree, the demographic groups most similar to Puget Sound Salish are Immigrants from Dominica (40.5%, a difference of 0.14%), Potawatomi (40.4%, a difference of 0.28%), Belizean (40.6%, a difference of 0.29%), Immigrants from Laos (40.7%, a difference of 0.36%), and Puerto Rican (40.4%, a difference of 0.38%).
| Demographics | Rating | Rank | Associate's Degree |
| Samoans | 0.2 /100 | #266 | Tragic 41.1% |
| Hawaiians | 0.2 /100 | #267 | Tragic 40.9% |
| Central American Indians | 0.2 /100 | #268 | Tragic 40.8% |
| Americans | 0.2 /100 | #269 | Tragic 40.8% |
| Chippewa | 0.2 /100 | #270 | Tragic 40.7% |
| Immigrants | Laos | 0.1 /100 | #271 | Tragic 40.7% |
| Belizeans | 0.1 /100 | #272 | Tragic 40.6% |
| Puget Sound Salish | 0.1 /100 | #273 | Tragic 40.5% |
| Immigrants | Dominica | 0.1 /100 | #274 | Tragic 40.5% |
| Potawatomi | 0.1 /100 | #275 | Tragic 40.4% |
| Puerto Ricans | 0.1 /100 | #276 | Tragic 40.4% |
| Blackfeet | 0.1 /100 | #277 | Tragic 40.3% |
| Ottawa | 0.1 /100 | #278 | Tragic 40.3% |
| Immigrants | Nicaragua | 0.1 /100 | #279 | Tragic 40.3% |
| Immigrants | Micronesia | 0.1 /100 | #280 | Tragic 40.2% |