Asian vs Macedonian Associate's Degree
COMPARE
Asian
Macedonian
Associate's Degree
Associate's Degree Comparison
Asians
Macedonians
52.1%
ASSOCIATE'S DEGREE
99.9/ 100
METRIC RATING
50th/ 347
METRIC RANK
49.6%
ASSOCIATE'S DEGREE
97.8/ 100
METRIC RATING
99th/ 347
METRIC RANK
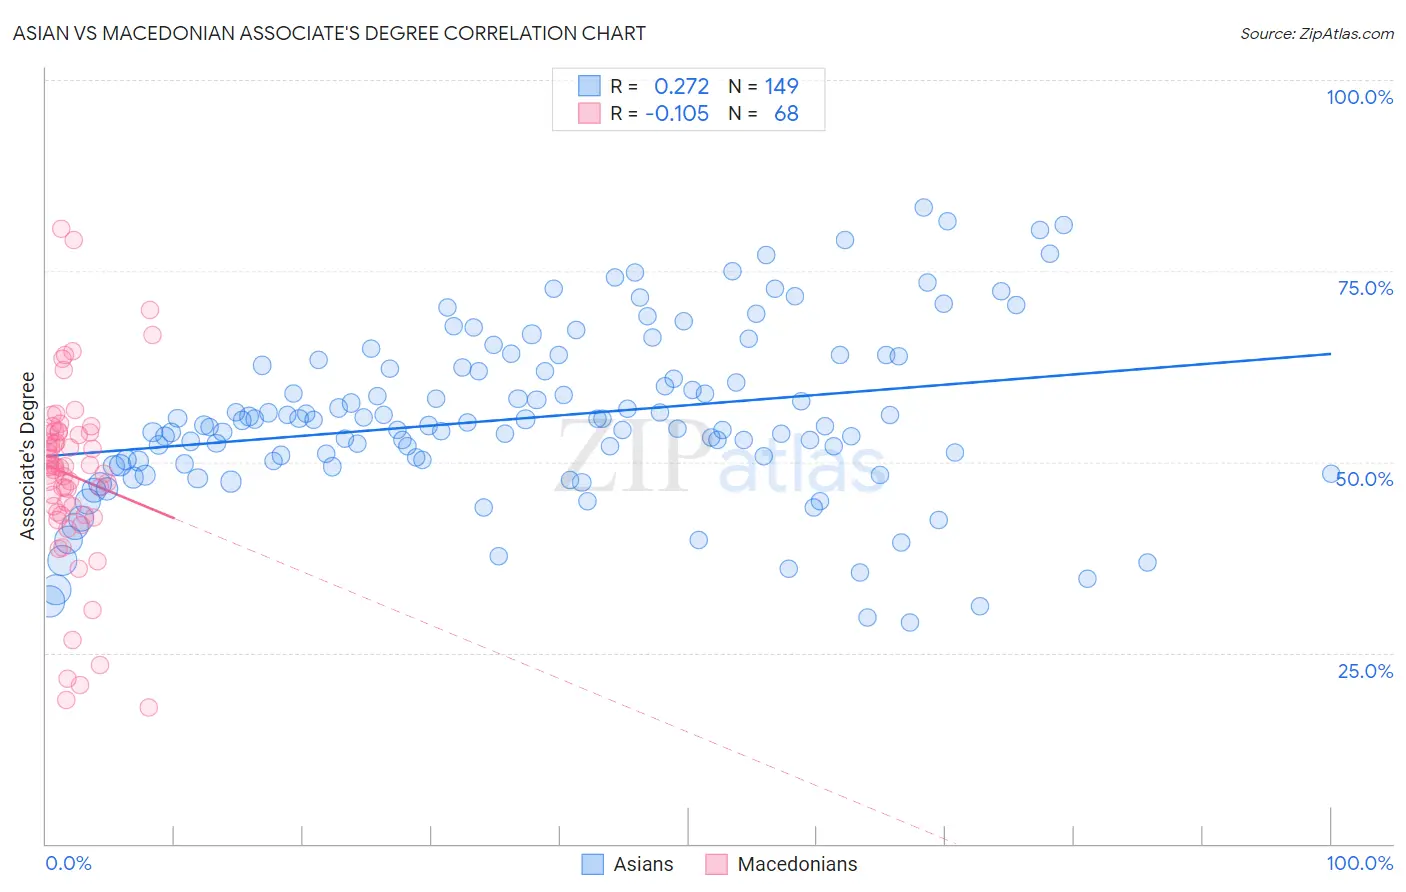
Asian vs Macedonian Associate's Degree Correlation Chart
The statistical analysis conducted on geographies consisting of 550,834,644 people shows a weak positive correlation between the proportion of Asians and percentage of population with at least associate's degree education in the United States with a correlation coefficient (R) of 0.272 and weighted average of 52.1%. Similarly, the statistical analysis conducted on geographies consisting of 132,656,097 people shows a poor negative correlation between the proportion of Macedonians and percentage of population with at least associate's degree education in the United States with a correlation coefficient (R) of -0.105 and weighted average of 49.6%, a difference of 5.0%.
Associate's Degree Correlation Summary
| Measurement | Asian | Macedonian |
| Minimum | 29.0% | 17.8% |
| Maximum | 83.3% | 80.6% |
| Range | 54.3% | 62.7% |
| Mean | 55.8% | 48.2% |
| Median | 54.8% | 49.4% |
| Interquartile 25% (IQ1) | 49.9% | 43.2% |
| Interquartile 75% (IQ3) | 62.5% | 53.9% |
| Interquartile Range (IQR) | 12.6% | 10.6% |
| Standard Deviation (Sample) | 11.1% | 12.1% |
| Standard Deviation (Population) | 11.1% | 12.0% |
Similar Demographics by Associate's Degree
Demographics Similar to Asians by Associate's Degree
In terms of associate's degree, the demographic groups most similar to Asians are Immigrants from Austria (52.1%, a difference of 0.010%), Immigrants from Greece (52.1%, a difference of 0.080%), Immigrants from Norway (52.2%, a difference of 0.21%), Bolivian (52.0%, a difference of 0.29%), and Immigrants from Asia (52.0%, a difference of 0.31%).
| Demographics | Rating | Rank | Associate's Degree |
| Immigrants | South Africa | 99.9 /100 | #43 | Exceptional 52.5% |
| Estonians | 99.9 /100 | #44 | Exceptional 52.5% |
| Immigrants | Lithuania | 99.9 /100 | #45 | Exceptional 52.4% |
| Immigrants | Bulgaria | 99.9 /100 | #46 | Exceptional 52.4% |
| Immigrants | Kuwait | 99.9 /100 | #47 | Exceptional 52.4% |
| Immigrants | Norway | 99.9 /100 | #48 | Exceptional 52.2% |
| Immigrants | Austria | 99.9 /100 | #49 | Exceptional 52.1% |
| Asians | 99.9 /100 | #50 | Exceptional 52.1% |
| Immigrants | Greece | 99.9 /100 | #51 | Exceptional 52.1% |
| Bolivians | 99.8 /100 | #52 | Exceptional 52.0% |
| Immigrants | Asia | 99.8 /100 | #53 | Exceptional 52.0% |
| Immigrants | Spain | 99.8 /100 | #54 | Exceptional 51.9% |
| Australians | 99.8 /100 | #55 | Exceptional 51.9% |
| Immigrants | Czechoslovakia | 99.8 /100 | #56 | Exceptional 51.9% |
| Paraguayans | 99.8 /100 | #57 | Exceptional 51.8% |
Demographics Similar to Macedonians by Associate's Degree
In terms of associate's degree, the demographic groups most similar to Macedonians are Immigrants from Northern Africa (49.7%, a difference of 0.070%), Romanian (49.7%, a difference of 0.16%), Immigrants from Ukraine (49.7%, a difference of 0.16%), Immigrants from England (49.7%, a difference of 0.18%), and Immigrants from Nepal (49.5%, a difference of 0.22%).
| Demographics | Rating | Rank | Associate's Degree |
| Immigrants | North America | 98.7 /100 | #92 | Exceptional 50.1% |
| Immigrants | Brazil | 98.5 /100 | #93 | Exceptional 50.0% |
| Laotians | 98.4 /100 | #94 | Exceptional 49.9% |
| Immigrants | England | 98.0 /100 | #95 | Exceptional 49.7% |
| Romanians | 98.0 /100 | #96 | Exceptional 49.7% |
| Immigrants | Ukraine | 98.0 /100 | #97 | Exceptional 49.7% |
| Immigrants | Northern Africa | 97.9 /100 | #98 | Exceptional 49.7% |
| Macedonians | 97.8 /100 | #99 | Exceptional 49.6% |
| Immigrants | Nepal | 97.5 /100 | #100 | Exceptional 49.5% |
| Northern Europeans | 97.3 /100 | #101 | Exceptional 49.5% |
| Chileans | 97.3 /100 | #102 | Exceptional 49.4% |
| Ukrainians | 97.1 /100 | #103 | Exceptional 49.4% |
| Venezuelans | 97.0 /100 | #104 | Exceptional 49.4% |
| Croatians | 96.8 /100 | #105 | Exceptional 49.3% |
| Immigrants | Italy | 96.7 /100 | #106 | Exceptional 49.3% |