Venezuelan vs Puget Sound Salish Associate's Degree
COMPARE
Venezuelan
Puget Sound Salish
Associate's Degree
Associate's Degree Comparison
Venezuelans
Puget Sound Salish
49.4%
ASSOCIATE'S DEGREE
97.0/ 100
METRIC RATING
104th/ 347
METRIC RANK
40.5%
ASSOCIATE'S DEGREE
0.1/ 100
METRIC RATING
273rd/ 347
METRIC RANK
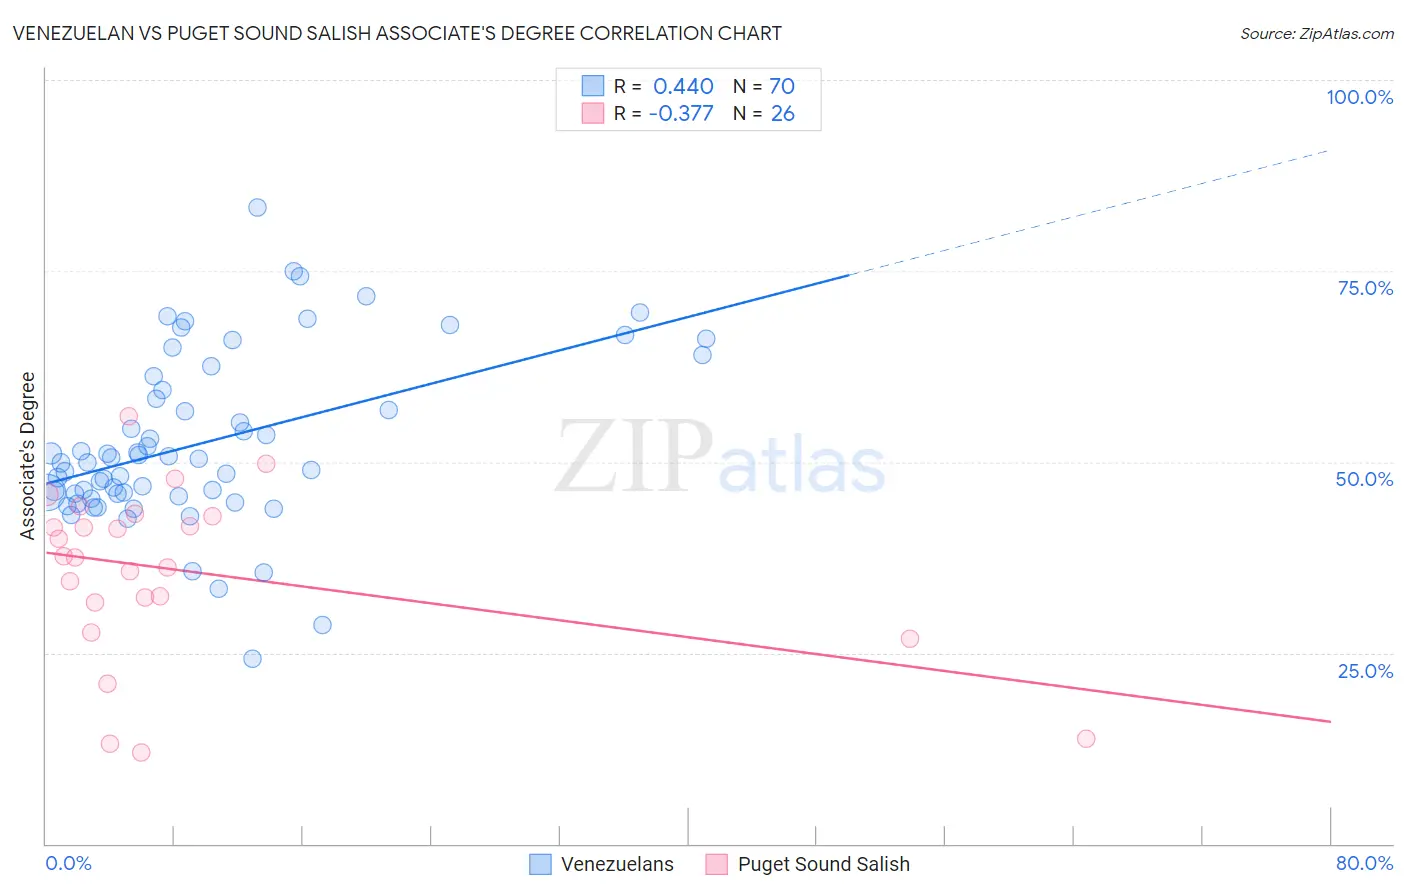
Venezuelan vs Puget Sound Salish Associate's Degree Correlation Chart
The statistical analysis conducted on geographies consisting of 306,307,372 people shows a moderate positive correlation between the proportion of Venezuelans and percentage of population with at least associate's degree education in the United States with a correlation coefficient (R) of 0.440 and weighted average of 49.4%. Similarly, the statistical analysis conducted on geographies consisting of 46,155,865 people shows a mild negative correlation between the proportion of Puget Sound Salish and percentage of population with at least associate's degree education in the United States with a correlation coefficient (R) of -0.377 and weighted average of 40.5%, a difference of 21.8%.
Associate's Degree Correlation Summary
| Measurement | Venezuelan | Puget Sound Salish |
| Minimum | 24.3% | 11.9% |
| Maximum | 83.4% | 56.0% |
| Range | 59.1% | 44.1% |
| Mean | 52.4% | 35.7% |
| Median | 50.1% | 37.6% |
| Interquartile 25% (IQ1) | 45.8% | 31.6% |
| Interquartile 75% (IQ3) | 59.4% | 42.9% |
| Interquartile Range (IQR) | 13.7% | 11.2% |
| Standard Deviation (Sample) | 11.2% | 11.2% |
| Standard Deviation (Population) | 11.1% | 11.0% |
Similar Demographics by Associate's Degree
Demographics Similar to Venezuelans by Associate's Degree
In terms of associate's degree, the demographic groups most similar to Venezuelans are Ukrainian (49.4%, a difference of 0.060%), Croatian (49.3%, a difference of 0.15%), Immigrants from Italy (49.3%, a difference of 0.15%), Chilean (49.4%, a difference of 0.17%), and Syrian (49.3%, a difference of 0.18%).
| Demographics | Rating | Rank | Associate's Degree |
| Immigrants | Ukraine | 98.0 /100 | #97 | Exceptional 49.7% |
| Immigrants | Northern Africa | 97.9 /100 | #98 | Exceptional 49.7% |
| Macedonians | 97.8 /100 | #99 | Exceptional 49.6% |
| Immigrants | Nepal | 97.5 /100 | #100 | Exceptional 49.5% |
| Northern Europeans | 97.3 /100 | #101 | Exceptional 49.5% |
| Chileans | 97.3 /100 | #102 | Exceptional 49.4% |
| Ukrainians | 97.1 /100 | #103 | Exceptional 49.4% |
| Venezuelans | 97.0 /100 | #104 | Exceptional 49.4% |
| Croatians | 96.8 /100 | #105 | Exceptional 49.3% |
| Immigrants | Italy | 96.7 /100 | #106 | Exceptional 49.3% |
| Syrians | 96.7 /100 | #107 | Exceptional 49.3% |
| Jordanians | 96.6 /100 | #108 | Exceptional 49.2% |
| Immigrants | Morocco | 96.3 /100 | #109 | Exceptional 49.2% |
| Austrians | 95.8 /100 | #110 | Exceptional 49.1% |
| Immigrants | Venezuela | 95.8 /100 | #111 | Exceptional 49.1% |
Demographics Similar to Puget Sound Salish by Associate's Degree
In terms of associate's degree, the demographic groups most similar to Puget Sound Salish are Immigrants from Dominica (40.5%, a difference of 0.14%), Potawatomi (40.4%, a difference of 0.28%), Belizean (40.6%, a difference of 0.29%), Immigrants from Laos (40.7%, a difference of 0.36%), and Puerto Rican (40.4%, a difference of 0.38%).
| Demographics | Rating | Rank | Associate's Degree |
| Samoans | 0.2 /100 | #266 | Tragic 41.1% |
| Hawaiians | 0.2 /100 | #267 | Tragic 40.9% |
| Central American Indians | 0.2 /100 | #268 | Tragic 40.8% |
| Americans | 0.2 /100 | #269 | Tragic 40.8% |
| Chippewa | 0.2 /100 | #270 | Tragic 40.7% |
| Immigrants | Laos | 0.1 /100 | #271 | Tragic 40.7% |
| Belizeans | 0.1 /100 | #272 | Tragic 40.6% |
| Puget Sound Salish | 0.1 /100 | #273 | Tragic 40.5% |
| Immigrants | Dominica | 0.1 /100 | #274 | Tragic 40.5% |
| Potawatomi | 0.1 /100 | #275 | Tragic 40.4% |
| Puerto Ricans | 0.1 /100 | #276 | Tragic 40.4% |
| Blackfeet | 0.1 /100 | #277 | Tragic 40.3% |
| Ottawa | 0.1 /100 | #278 | Tragic 40.3% |
| Immigrants | Nicaragua | 0.1 /100 | #279 | Tragic 40.3% |
| Immigrants | Micronesia | 0.1 /100 | #280 | Tragic 40.2% |