Asian vs Inupiat Associate's Degree
COMPARE
Asian
Inupiat
Associate's Degree
Associate's Degree Comparison
Asians
Inupiat
52.1%
ASSOCIATE'S DEGREE
99.9/ 100
METRIC RATING
50th/ 347
METRIC RANK
32.6%
ASSOCIATE'S DEGREE
0.0/ 100
METRIC RATING
341st/ 347
METRIC RANK
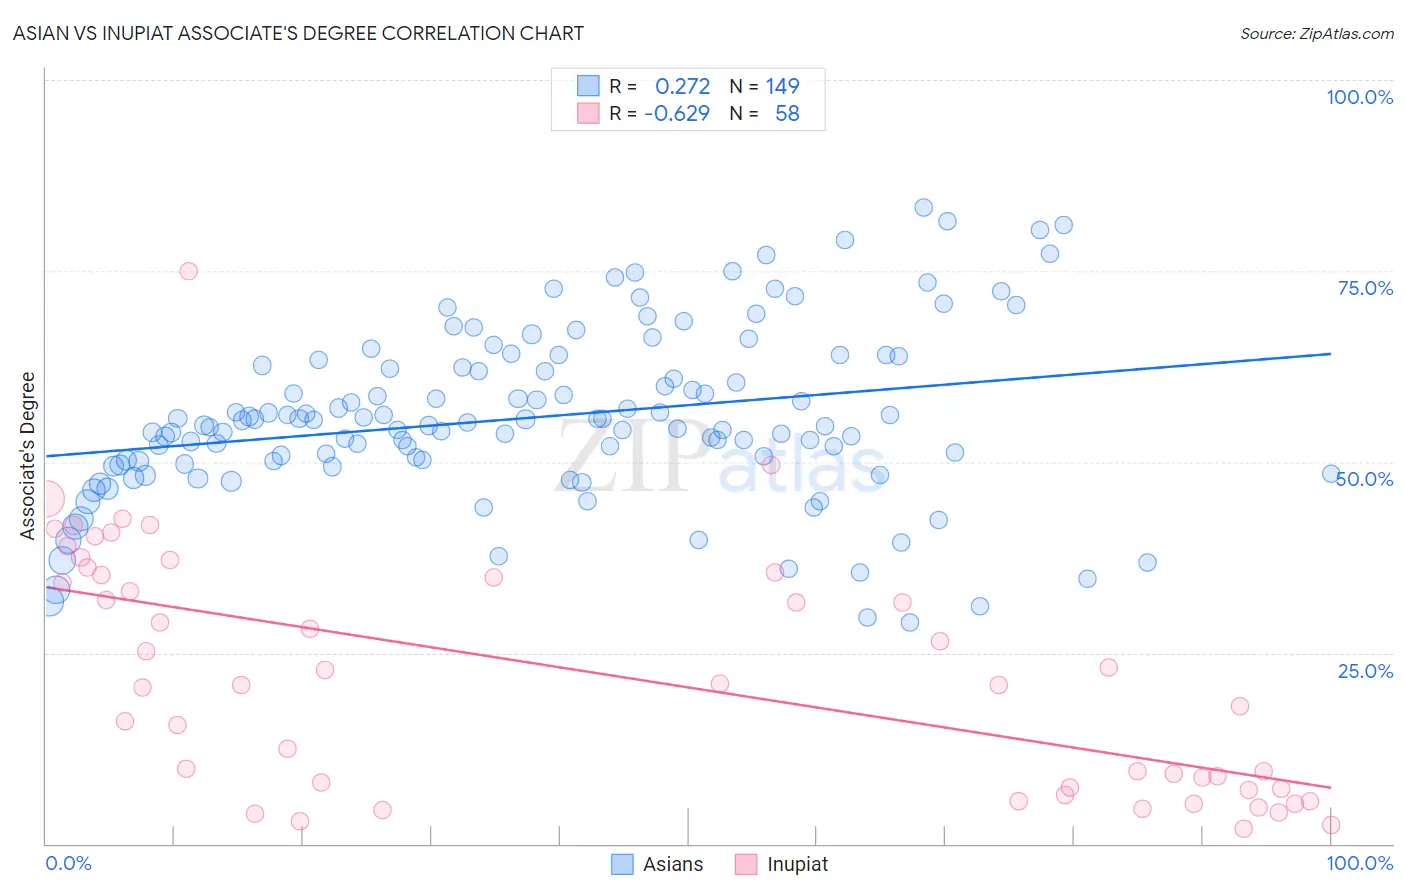
Asian vs Inupiat Associate's Degree Correlation Chart
The statistical analysis conducted on geographies consisting of 550,834,644 people shows a weak positive correlation between the proportion of Asians and percentage of population with at least associate's degree education in the United States with a correlation coefficient (R) of 0.272 and weighted average of 52.1%. Similarly, the statistical analysis conducted on geographies consisting of 96,347,955 people shows a significant negative correlation between the proportion of Inupiat and percentage of population with at least associate's degree education in the United States with a correlation coefficient (R) of -0.629 and weighted average of 32.6%, a difference of 60.1%.
Associate's Degree Correlation Summary
| Measurement | Asian | Inupiat |
| Minimum | 29.0% | 1.9% |
| Maximum | 83.3% | 75.0% |
| Range | 54.3% | 73.1% |
| Mean | 55.8% | 22.0% |
| Median | 54.8% | 20.8% |
| Interquartile 25% (IQ1) | 49.9% | 7.3% |
| Interquartile 75% (IQ3) | 62.5% | 35.2% |
| Interquartile Range (IQR) | 12.6% | 27.9% |
| Standard Deviation (Sample) | 11.1% | 16.0% |
| Standard Deviation (Population) | 11.1% | 15.9% |
Similar Demographics by Associate's Degree
Demographics Similar to Asians by Associate's Degree
In terms of associate's degree, the demographic groups most similar to Asians are Immigrants from Austria (52.1%, a difference of 0.010%), Immigrants from Greece (52.1%, a difference of 0.080%), Immigrants from Norway (52.2%, a difference of 0.21%), Bolivian (52.0%, a difference of 0.29%), and Immigrants from Asia (52.0%, a difference of 0.31%).
| Demographics | Rating | Rank | Associate's Degree |
| Immigrants | South Africa | 99.9 /100 | #43 | Exceptional 52.5% |
| Estonians | 99.9 /100 | #44 | Exceptional 52.5% |
| Immigrants | Lithuania | 99.9 /100 | #45 | Exceptional 52.4% |
| Immigrants | Bulgaria | 99.9 /100 | #46 | Exceptional 52.4% |
| Immigrants | Kuwait | 99.9 /100 | #47 | Exceptional 52.4% |
| Immigrants | Norway | 99.9 /100 | #48 | Exceptional 52.2% |
| Immigrants | Austria | 99.9 /100 | #49 | Exceptional 52.1% |
| Asians | 99.9 /100 | #50 | Exceptional 52.1% |
| Immigrants | Greece | 99.9 /100 | #51 | Exceptional 52.1% |
| Bolivians | 99.8 /100 | #52 | Exceptional 52.0% |
| Immigrants | Asia | 99.8 /100 | #53 | Exceptional 52.0% |
| Immigrants | Spain | 99.8 /100 | #54 | Exceptional 51.9% |
| Australians | 99.8 /100 | #55 | Exceptional 51.9% |
| Immigrants | Czechoslovakia | 99.8 /100 | #56 | Exceptional 51.9% |
| Paraguayans | 99.8 /100 | #57 | Exceptional 51.8% |
Demographics Similar to Inupiat by Associate's Degree
In terms of associate's degree, the demographic groups most similar to Inupiat are Navajo (32.6%, a difference of 0.050%), Yakama (32.3%, a difference of 0.77%), Tohono O'odham (31.8%, a difference of 2.5%), Immigrants from Mexico (33.7%, a difference of 3.6%), and Yuman (31.3%, a difference of 4.2%).
| Demographics | Rating | Rank | Associate's Degree |
| Mexicans | 0.0 /100 | #333 | Tragic 35.0% |
| Natives/Alaskans | 0.0 /100 | #334 | Tragic 34.9% |
| Spanish American Indians | 0.0 /100 | #335 | Tragic 34.9% |
| Hopi | 0.0 /100 | #336 | Tragic 34.6% |
| Lumbee | 0.0 /100 | #337 | Tragic 34.1% |
| Pueblo | 0.0 /100 | #338 | Tragic 34.0% |
| Immigrants | Mexico | 0.0 /100 | #339 | Tragic 33.7% |
| Navajo | 0.0 /100 | #340 | Tragic 32.6% |
| Inupiat | 0.0 /100 | #341 | Tragic 32.6% |
| Yakama | 0.0 /100 | #342 | Tragic 32.3% |
| Tohono O'odham | 0.0 /100 | #343 | Tragic 31.8% |
| Yuman | 0.0 /100 | #344 | Tragic 31.3% |
| Pima | 0.0 /100 | #345 | Tragic 30.2% |
| Houma | 0.0 /100 | #346 | Tragic 28.2% |
| Yup'ik | 0.0 /100 | #347 | Tragic 25.0% |