Asian vs Immigrants from Belize Associate's Degree
COMPARE
Asian
Immigrants from Belize
Associate's Degree
Associate's Degree Comparison
Asians
Immigrants from Belize
52.1%
ASSOCIATE'S DEGREE
99.9/ 100
METRIC RATING
50th/ 347
METRIC RANK
39.9%
ASSOCIATE'S DEGREE
0.1/ 100
METRIC RATING
285th/ 347
METRIC RANK
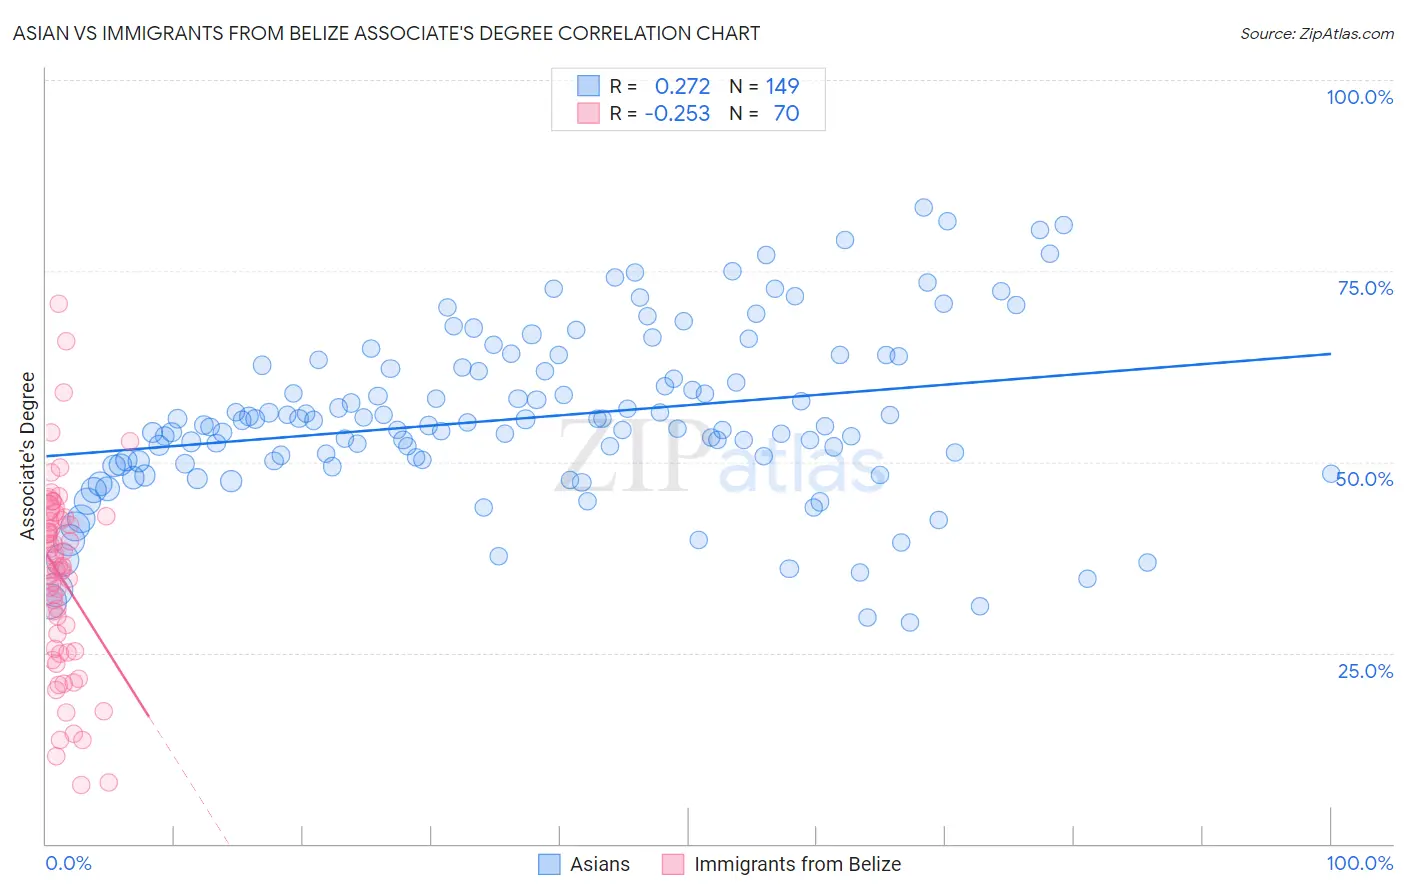
Asian vs Immigrants from Belize Associate's Degree Correlation Chart
The statistical analysis conducted on geographies consisting of 550,834,644 people shows a weak positive correlation between the proportion of Asians and percentage of population with at least associate's degree education in the United States with a correlation coefficient (R) of 0.272 and weighted average of 52.1%. Similarly, the statistical analysis conducted on geographies consisting of 130,322,630 people shows a weak negative correlation between the proportion of Immigrants from Belize and percentage of population with at least associate's degree education in the United States with a correlation coefficient (R) of -0.253 and weighted average of 39.9%, a difference of 30.7%.
Associate's Degree Correlation Summary
| Measurement | Asian | Immigrants from Belize |
| Minimum | 29.0% | 7.7% |
| Maximum | 83.3% | 70.8% |
| Range | 54.3% | 63.1% |
| Mean | 55.8% | 34.9% |
| Median | 54.8% | 36.1% |
| Interquartile 25% (IQ1) | 49.9% | 25.1% |
| Interquartile 75% (IQ3) | 62.5% | 42.6% |
| Interquartile Range (IQR) | 12.6% | 17.5% |
| Standard Deviation (Sample) | 11.1% | 12.7% |
| Standard Deviation (Population) | 11.1% | 12.6% |
Similar Demographics by Associate's Degree
Demographics Similar to Asians by Associate's Degree
In terms of associate's degree, the demographic groups most similar to Asians are Immigrants from Austria (52.1%, a difference of 0.010%), Immigrants from Greece (52.1%, a difference of 0.080%), Immigrants from Norway (52.2%, a difference of 0.21%), Bolivian (52.0%, a difference of 0.29%), and Immigrants from Asia (52.0%, a difference of 0.31%).
| Demographics | Rating | Rank | Associate's Degree |
| Immigrants | South Africa | 99.9 /100 | #43 | Exceptional 52.5% |
| Estonians | 99.9 /100 | #44 | Exceptional 52.5% |
| Immigrants | Lithuania | 99.9 /100 | #45 | Exceptional 52.4% |
| Immigrants | Bulgaria | 99.9 /100 | #46 | Exceptional 52.4% |
| Immigrants | Kuwait | 99.9 /100 | #47 | Exceptional 52.4% |
| Immigrants | Norway | 99.9 /100 | #48 | Exceptional 52.2% |
| Immigrants | Austria | 99.9 /100 | #49 | Exceptional 52.1% |
| Asians | 99.9 /100 | #50 | Exceptional 52.1% |
| Immigrants | Greece | 99.9 /100 | #51 | Exceptional 52.1% |
| Bolivians | 99.8 /100 | #52 | Exceptional 52.0% |
| Immigrants | Asia | 99.8 /100 | #53 | Exceptional 52.0% |
| Immigrants | Spain | 99.8 /100 | #54 | Exceptional 51.9% |
| Australians | 99.8 /100 | #55 | Exceptional 51.9% |
| Immigrants | Czechoslovakia | 99.8 /100 | #56 | Exceptional 51.9% |
| Paraguayans | 99.8 /100 | #57 | Exceptional 51.8% |
Demographics Similar to Immigrants from Belize by Associate's Degree
In terms of associate's degree, the demographic groups most similar to Immigrants from Belize are Comanche (39.9%, a difference of 0.10%), Haitian (40.0%, a difference of 0.21%), Immigrants from Caribbean (39.7%, a difference of 0.34%), Bangladeshi (40.0%, a difference of 0.36%), and Aleut (39.6%, a difference of 0.60%).
| Demographics | Rating | Rank | Associate's Degree |
| Ottawa | 0.1 /100 | #278 | Tragic 40.3% |
| Immigrants | Nicaragua | 0.1 /100 | #279 | Tragic 40.3% |
| Immigrants | Micronesia | 0.1 /100 | #280 | Tragic 40.2% |
| Immigrants | Portugal | 0.1 /100 | #281 | Tragic 40.1% |
| Bangladeshis | 0.1 /100 | #282 | Tragic 40.0% |
| Haitians | 0.1 /100 | #283 | Tragic 40.0% |
| Comanche | 0.1 /100 | #284 | Tragic 39.9% |
| Immigrants | Belize | 0.1 /100 | #285 | Tragic 39.9% |
| Immigrants | Caribbean | 0.0 /100 | #286 | Tragic 39.7% |
| Aleuts | 0.0 /100 | #287 | Tragic 39.6% |
| Immigrants | Cuba | 0.0 /100 | #288 | Tragic 39.5% |
| Central Americans | 0.0 /100 | #289 | Tragic 39.4% |
| Immigrants | Haiti | 0.0 /100 | #290 | Tragic 39.3% |
| Dominicans | 0.0 /100 | #291 | Tragic 39.3% |
| Blacks/African Americans | 0.0 /100 | #292 | Tragic 39.1% |