Alsatian vs Immigrants from Hong Kong Family Households
COMPARE
Alsatian
Immigrants from Hong Kong
Family Households
Family Households Comparison
Alsatians
Immigrants from Hong Kong
61.7%
FAMILY HOUSEHOLDS
0.0/ 100
METRIC RATING
321st/ 347
METRIC RANK
66.1%
FAMILY HOUSEHOLDS
100.0/ 100
METRIC RATING
56th/ 347
METRIC RANK
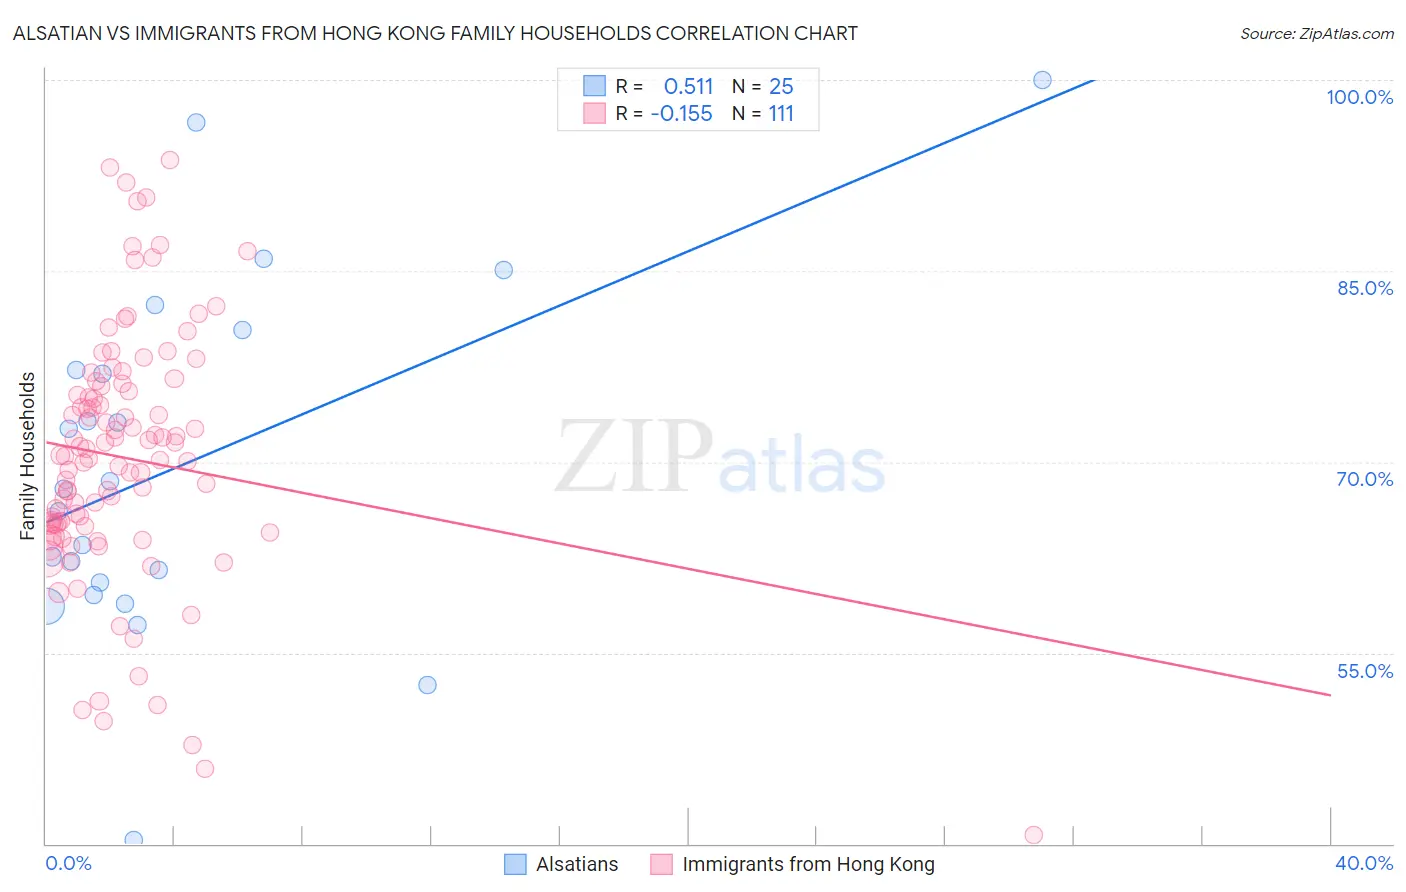
Alsatian vs Immigrants from Hong Kong Family Households Correlation Chart
The statistical analysis conducted on geographies consisting of 82,680,020 people shows a substantial positive correlation between the proportion of Alsatians and percentage of family households in the United States with a correlation coefficient (R) of 0.511 and weighted average of 61.7%. Similarly, the statistical analysis conducted on geographies consisting of 253,896,995 people shows a poor negative correlation between the proportion of Immigrants from Hong Kong and percentage of family households in the United States with a correlation coefficient (R) of -0.155 and weighted average of 66.1%, a difference of 7.2%.
Family Households Correlation Summary
| Measurement | Alsatian | Immigrants from Hong Kong |
| Minimum | 40.3% | 40.7% |
| Maximum | 100.0% | 93.8% |
| Range | 59.7% | 53.1% |
| Mean | 69.7% | 70.3% |
| Median | 67.9% | 70.5% |
| Interquartile 25% (IQ1) | 60.0% | 65.1% |
| Interquartile 75% (IQ3) | 78.8% | 75.9% |
| Interquartile Range (IQR) | 18.7% | 10.8% |
| Standard Deviation (Sample) | 13.7% | 9.9% |
| Standard Deviation (Population) | 13.5% | 9.9% |
Similar Demographics by Family Households
Demographics Similar to Alsatians by Family Households
In terms of family households, the demographic groups most similar to Alsatians are Ugandan (61.7%, a difference of 0.050%), Immigrants from Serbia (61.6%, a difference of 0.090%), Tlingit-Haida (61.6%, a difference of 0.10%), Immigrants from West Indies (61.6%, a difference of 0.10%), and Immigrants from Switzerland (61.6%, a difference of 0.11%).
| Demographics | Rating | Rank | Family Households |
| Immigrants | Cabo Verde | 0.0 /100 | #314 | Tragic 61.9% |
| Moroccans | 0.0 /100 | #315 | Tragic 61.9% |
| Immigrants | Middle Africa | 0.0 /100 | #316 | Tragic 61.9% |
| Immigrants | Bosnia and Herzegovina | 0.0 /100 | #317 | Tragic 61.9% |
| Alaskan Athabascans | 0.0 /100 | #318 | Tragic 61.8% |
| Cape Verdeans | 0.0 /100 | #319 | Tragic 61.8% |
| Ugandans | 0.0 /100 | #320 | Tragic 61.7% |
| Alsatians | 0.0 /100 | #321 | Tragic 61.7% |
| Immigrants | Serbia | 0.0 /100 | #322 | Tragic 61.6% |
| Tlingit-Haida | 0.0 /100 | #323 | Tragic 61.6% |
| Immigrants | West Indies | 0.0 /100 | #324 | Tragic 61.6% |
| Immigrants | Switzerland | 0.0 /100 | #325 | Tragic 61.6% |
| Indonesians | 0.0 /100 | #326 | Tragic 61.5% |
| Blacks/African Americans | 0.0 /100 | #327 | Tragic 61.5% |
| Kiowa | 0.0 /100 | #328 | Tragic 61.4% |
Demographics Similar to Immigrants from Hong Kong by Family Households
In terms of family households, the demographic groups most similar to Immigrants from Hong Kong are Immigrants (66.1%, a difference of 0.010%), Pennsylvania German (66.1%, a difference of 0.020%), Immigrants from Asia (66.1%, a difference of 0.13%), Immigrants from Korea (66.0%, a difference of 0.15%), and South American (66.0%, a difference of 0.15%).
| Demographics | Rating | Rank | Family Households |
| Immigrants | South Central Asia | 100.0 /100 | #49 | Exceptional 66.4% |
| Navajo | 100.0 /100 | #50 | Exceptional 66.4% |
| Natives/Alaskans | 100.0 /100 | #51 | Exceptional 66.4% |
| Colombians | 100.0 /100 | #52 | Exceptional 66.3% |
| Afghans | 100.0 /100 | #53 | Exceptional 66.3% |
| Immigrants | Colombia | 100.0 /100 | #54 | Exceptional 66.3% |
| Immigrants | Immigrants | 100.0 /100 | #55 | Exceptional 66.1% |
| Immigrants | Hong Kong | 100.0 /100 | #56 | Exceptional 66.1% |
| Pennsylvania Germans | 100.0 /100 | #57 | Exceptional 66.1% |
| Immigrants | Asia | 100.0 /100 | #58 | Exceptional 66.1% |
| Immigrants | Korea | 100.0 /100 | #59 | Exceptional 66.0% |
| South Americans | 100.0 /100 | #60 | Exceptional 66.0% |
| Danes | 100.0 /100 | #61 | Exceptional 66.0% |
| Central Americans | 100.0 /100 | #62 | Exceptional 66.0% |
| Immigrants | Indonesia | 100.0 /100 | #63 | Exceptional 66.0% |