Scotch-Irish vs Immigrants from Uruguay Vision Disability
COMPARE
Scotch-Irish
Immigrants from Uruguay
Vision Disability
Vision Disability Comparison
Scotch-Irish
Immigrants from Uruguay
2.4%
VISION DISABILITY
0.0/ 100
METRIC RATING
276th/ 347
METRIC RANK
2.2%
VISION DISABILITY
11.5/ 100
METRIC RATING
210th/ 347
METRIC RANK
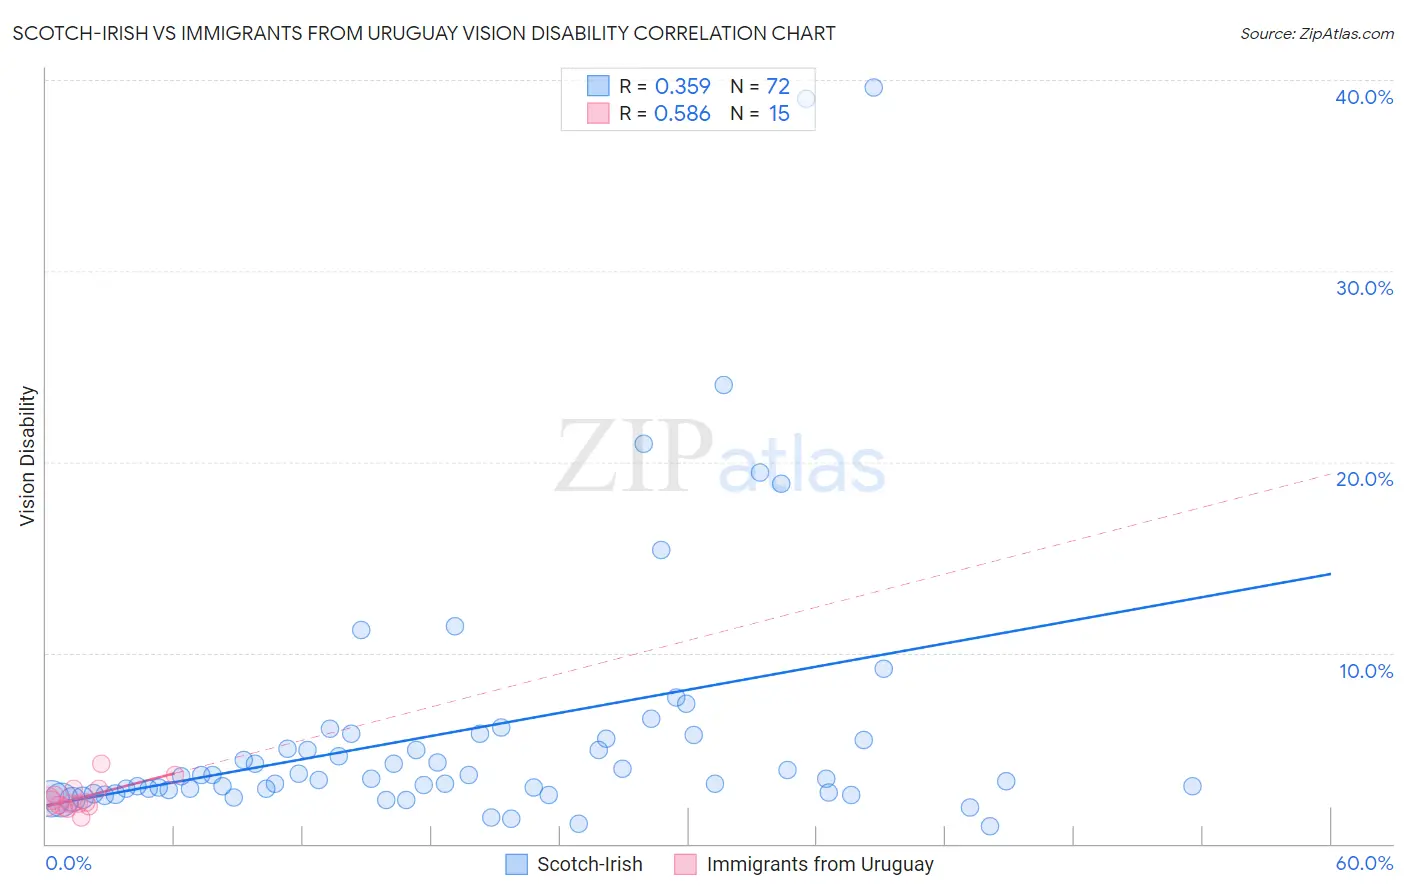
Scotch-Irish vs Immigrants from Uruguay Vision Disability Correlation Chart
The statistical analysis conducted on geographies consisting of 547,366,805 people shows a mild positive correlation between the proportion of Scotch-Irish and percentage of population with vision disability in the United States with a correlation coefficient (R) of 0.359 and weighted average of 2.4%. Similarly, the statistical analysis conducted on geographies consisting of 133,246,833 people shows a substantial positive correlation between the proportion of Immigrants from Uruguay and percentage of population with vision disability in the United States with a correlation coefficient (R) of 0.586 and weighted average of 2.2%, a difference of 9.1%.
Vision Disability Correlation Summary
| Measurement | Scotch-Irish | Immigrants from Uruguay |
| Minimum | 0.89% | 1.4% |
| Maximum | 39.6% | 4.2% |
| Range | 38.7% | 2.8% |
| Mean | 6.0% | 2.4% |
| Median | 3.5% | 2.1% |
| Interquartile 25% (IQ1) | 2.7% | 2.0% |
| Interquartile 75% (IQ3) | 5.6% | 2.8% |
| Interquartile Range (IQR) | 2.9% | 0.89% |
| Standard Deviation (Sample) | 7.3% | 0.72% |
| Standard Deviation (Population) | 7.2% | 0.69% |
Similar Demographics by Vision Disability
Demographics Similar to Scotch-Irish by Vision Disability
In terms of vision disability, the demographic groups most similar to Scotch-Irish are Bahamian (2.4%, a difference of 0.040%), Chippewa (2.4%, a difference of 0.090%), Spanish (2.4%, a difference of 0.20%), Nepalese (2.4%, a difference of 0.21%), and Cape Verdean (2.4%, a difference of 0.25%).
| Demographics | Rating | Rank | Vision Disability |
| Celtics | 0.1 /100 | #269 | Tragic 2.4% |
| Cubans | 0.1 /100 | #270 | Tragic 2.4% |
| Immigrants | Azores | 0.1 /100 | #271 | Tragic 2.4% |
| Spaniards | 0.1 /100 | #272 | Tragic 2.4% |
| Immigrants | Bahamas | 0.1 /100 | #273 | Tragic 2.4% |
| Immigrants | Latin America | 0.0 /100 | #274 | Tragic 2.4% |
| Chippewa | 0.0 /100 | #275 | Tragic 2.4% |
| Scotch-Irish | 0.0 /100 | #276 | Tragic 2.4% |
| Bahamians | 0.0 /100 | #277 | Tragic 2.4% |
| Spanish | 0.0 /100 | #278 | Tragic 2.4% |
| Nepalese | 0.0 /100 | #279 | Tragic 2.4% |
| Cape Verdeans | 0.0 /100 | #280 | Tragic 2.4% |
| U.S. Virgin Islanders | 0.0 /100 | #281 | Tragic 2.5% |
| Immigrants | Caribbean | 0.0 /100 | #282 | Tragic 2.5% |
| Puget Sound Salish | 0.0 /100 | #283 | Tragic 2.5% |
Demographics Similar to Immigrants from Uruguay by Vision Disability
In terms of vision disability, the demographic groups most similar to Immigrants from Uruguay are Immigrants from Brazil (2.2%, a difference of 0.23%), Immigrants from Nigeria (2.2%, a difference of 0.27%), German (2.2%, a difference of 0.27%), Indonesian (2.2%, a difference of 0.34%), and Pennsylvania German (2.2%, a difference of 0.41%).
| Demographics | Rating | Rank | Vision Disability |
| Dutch | 17.1 /100 | #203 | Poor 2.2% |
| Immigrants | Guyana | 15.9 /100 | #204 | Poor 2.2% |
| Samoans | 15.7 /100 | #205 | Poor 2.2% |
| Pennsylvania Germans | 14.5 /100 | #206 | Poor 2.2% |
| Immigrants | Nigeria | 13.5 /100 | #207 | Poor 2.2% |
| Germans | 13.4 /100 | #208 | Poor 2.2% |
| Immigrants | Brazil | 13.1 /100 | #209 | Poor 2.2% |
| Immigrants | Uruguay | 11.5 /100 | #210 | Poor 2.2% |
| Indonesians | 9.5 /100 | #211 | Tragic 2.2% |
| Bermudans | 9.0 /100 | #212 | Tragic 2.2% |
| Immigrants | Ghana | 8.9 /100 | #213 | Tragic 2.2% |
| Trinidadians and Tobagonians | 8.2 /100 | #214 | Tragic 2.2% |
| Nigerians | 7.2 /100 | #215 | Tragic 2.3% |
| Immigrants | Trinidad and Tobago | 6.1 /100 | #216 | Tragic 2.3% |
| Barbadians | 5.1 /100 | #217 | Tragic 2.3% |