Scotch-Irish vs Immigrants from Somalia Vision Disability
COMPARE
Scotch-Irish
Immigrants from Somalia
Vision Disability
Vision Disability Comparison
Scotch-Irish
Immigrants from Somalia
2.4%
VISION DISABILITY
0.0/ 100
METRIC RATING
276th/ 347
METRIC RANK
2.1%
VISION DISABILITY
96.2/ 100
METRIC RATING
91st/ 347
METRIC RANK
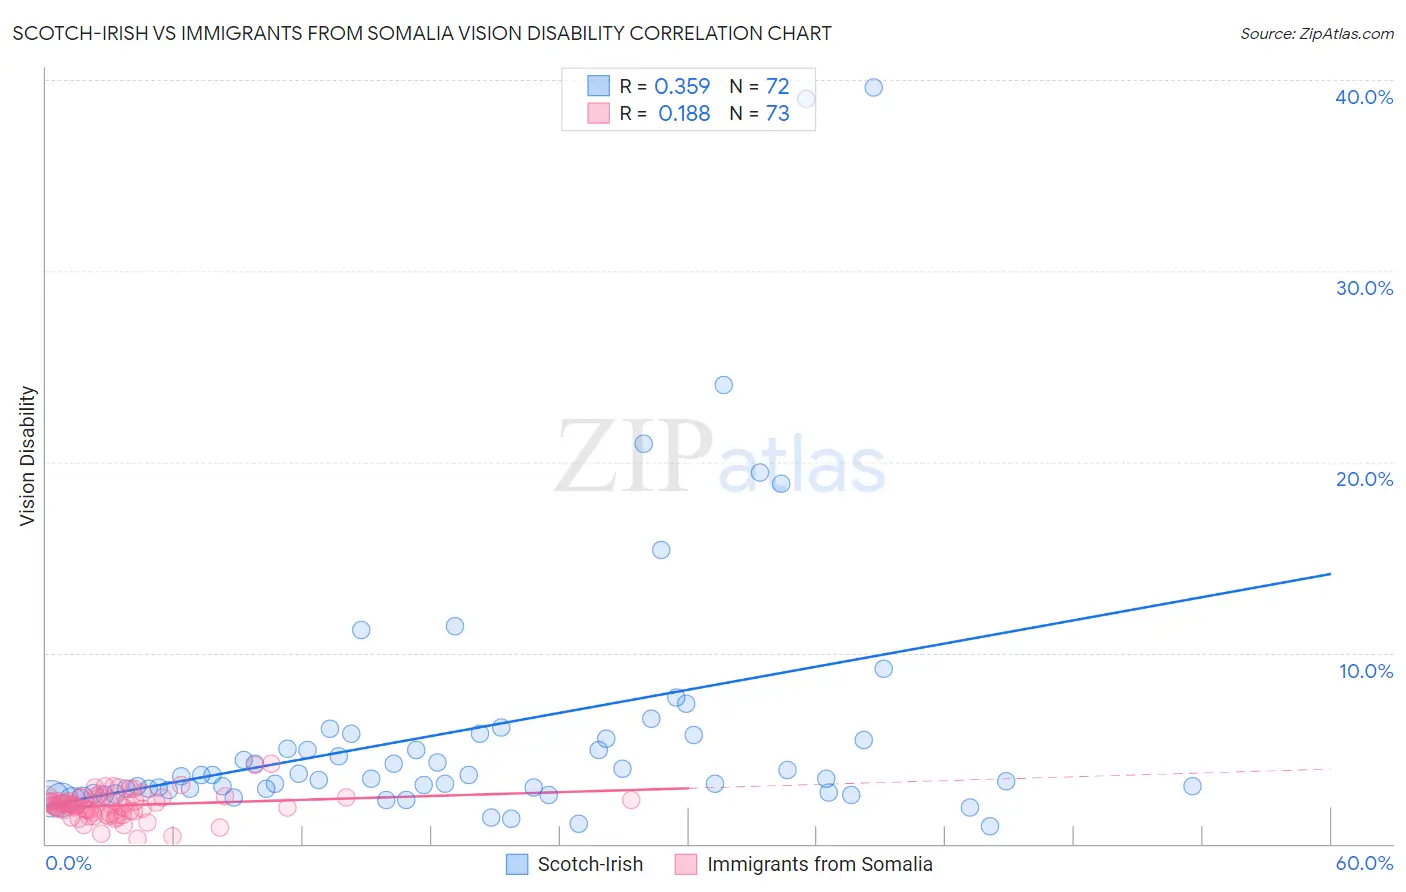
Scotch-Irish vs Immigrants from Somalia Vision Disability Correlation Chart
The statistical analysis conducted on geographies consisting of 547,366,805 people shows a mild positive correlation between the proportion of Scotch-Irish and percentage of population with vision disability in the United States with a correlation coefficient (R) of 0.359 and weighted average of 2.4%. Similarly, the statistical analysis conducted on geographies consisting of 92,068,110 people shows a poor positive correlation between the proportion of Immigrants from Somalia and percentage of population with vision disability in the United States with a correlation coefficient (R) of 0.188 and weighted average of 2.1%, a difference of 18.7%.
Vision Disability Correlation Summary
| Measurement | Scotch-Irish | Immigrants from Somalia |
| Minimum | 0.89% | 0.23% |
| Maximum | 39.6% | 4.2% |
| Range | 38.7% | 4.0% |
| Mean | 6.0% | 2.0% |
| Median | 3.5% | 2.0% |
| Interquartile 25% (IQ1) | 2.7% | 1.6% |
| Interquartile 75% (IQ3) | 5.6% | 2.4% |
| Interquartile Range (IQR) | 2.9% | 0.80% |
| Standard Deviation (Sample) | 7.3% | 0.70% |
| Standard Deviation (Population) | 7.2% | 0.69% |
Similar Demographics by Vision Disability
Demographics Similar to Scotch-Irish by Vision Disability
In terms of vision disability, the demographic groups most similar to Scotch-Irish are Bahamian (2.4%, a difference of 0.040%), Chippewa (2.4%, a difference of 0.090%), Spanish (2.4%, a difference of 0.20%), Nepalese (2.4%, a difference of 0.21%), and Cape Verdean (2.4%, a difference of 0.25%).
| Demographics | Rating | Rank | Vision Disability |
| Celtics | 0.1 /100 | #269 | Tragic 2.4% |
| Cubans | 0.1 /100 | #270 | Tragic 2.4% |
| Immigrants | Azores | 0.1 /100 | #271 | Tragic 2.4% |
| Spaniards | 0.1 /100 | #272 | Tragic 2.4% |
| Immigrants | Bahamas | 0.1 /100 | #273 | Tragic 2.4% |
| Immigrants | Latin America | 0.0 /100 | #274 | Tragic 2.4% |
| Chippewa | 0.0 /100 | #275 | Tragic 2.4% |
| Scotch-Irish | 0.0 /100 | #276 | Tragic 2.4% |
| Bahamians | 0.0 /100 | #277 | Tragic 2.4% |
| Spanish | 0.0 /100 | #278 | Tragic 2.4% |
| Nepalese | 0.0 /100 | #279 | Tragic 2.4% |
| Cape Verdeans | 0.0 /100 | #280 | Tragic 2.4% |
| U.S. Virgin Islanders | 0.0 /100 | #281 | Tragic 2.5% |
| Immigrants | Caribbean | 0.0 /100 | #282 | Tragic 2.5% |
| Puget Sound Salish | 0.0 /100 | #283 | Tragic 2.5% |
Demographics Similar to Immigrants from Somalia by Vision Disability
In terms of vision disability, the demographic groups most similar to Immigrants from Somalia are Immigrants from Syria (2.1%, a difference of 0.020%), Immigrants from Europe (2.1%, a difference of 0.060%), Immigrants from Croatia (2.1%, a difference of 0.090%), Australian (2.1%, a difference of 0.16%), and Romanian (2.1%, a difference of 0.22%).
| Demographics | Rating | Rank | Vision Disability |
| Immigrants | Latvia | 97.3 /100 | #84 | Exceptional 2.0% |
| Chinese | 97.2 /100 | #85 | Exceptional 2.0% |
| Immigrants | Moldova | 97.2 /100 | #86 | Exceptional 2.0% |
| Immigrants | Switzerland | 97.0 /100 | #87 | Exceptional 2.0% |
| Norwegians | 97.0 /100 | #88 | Exceptional 2.0% |
| Immigrants | Eastern Africa | 97.0 /100 | #89 | Exceptional 2.0% |
| Immigrants | Lebanon | 96.7 /100 | #90 | Exceptional 2.1% |
| Immigrants | Somalia | 96.2 /100 | #91 | Exceptional 2.1% |
| Immigrants | Syria | 96.2 /100 | #92 | Exceptional 2.1% |
| Immigrants | Europe | 96.1 /100 | #93 | Exceptional 2.1% |
| Immigrants | Croatia | 96.0 /100 | #94 | Exceptional 2.1% |
| Australians | 95.9 /100 | #95 | Exceptional 2.1% |
| Romanians | 95.7 /100 | #96 | Exceptional 2.1% |
| Immigrants | Afghanistan | 95.6 /100 | #97 | Exceptional 2.1% |
| Immigrants | South Africa | 95.4 /100 | #98 | Exceptional 2.1% |