Scotch-Irish vs Ethiopian Vision Disability
COMPARE
Scotch-Irish
Ethiopian
Vision Disability
Vision Disability Comparison
Scotch-Irish
Ethiopians
2.4%
VISION DISABILITY
0.0/ 100
METRIC RATING
276th/ 347
METRIC RANK
2.0%
VISION DISABILITY
99.7/ 100
METRIC RATING
45th/ 347
METRIC RANK
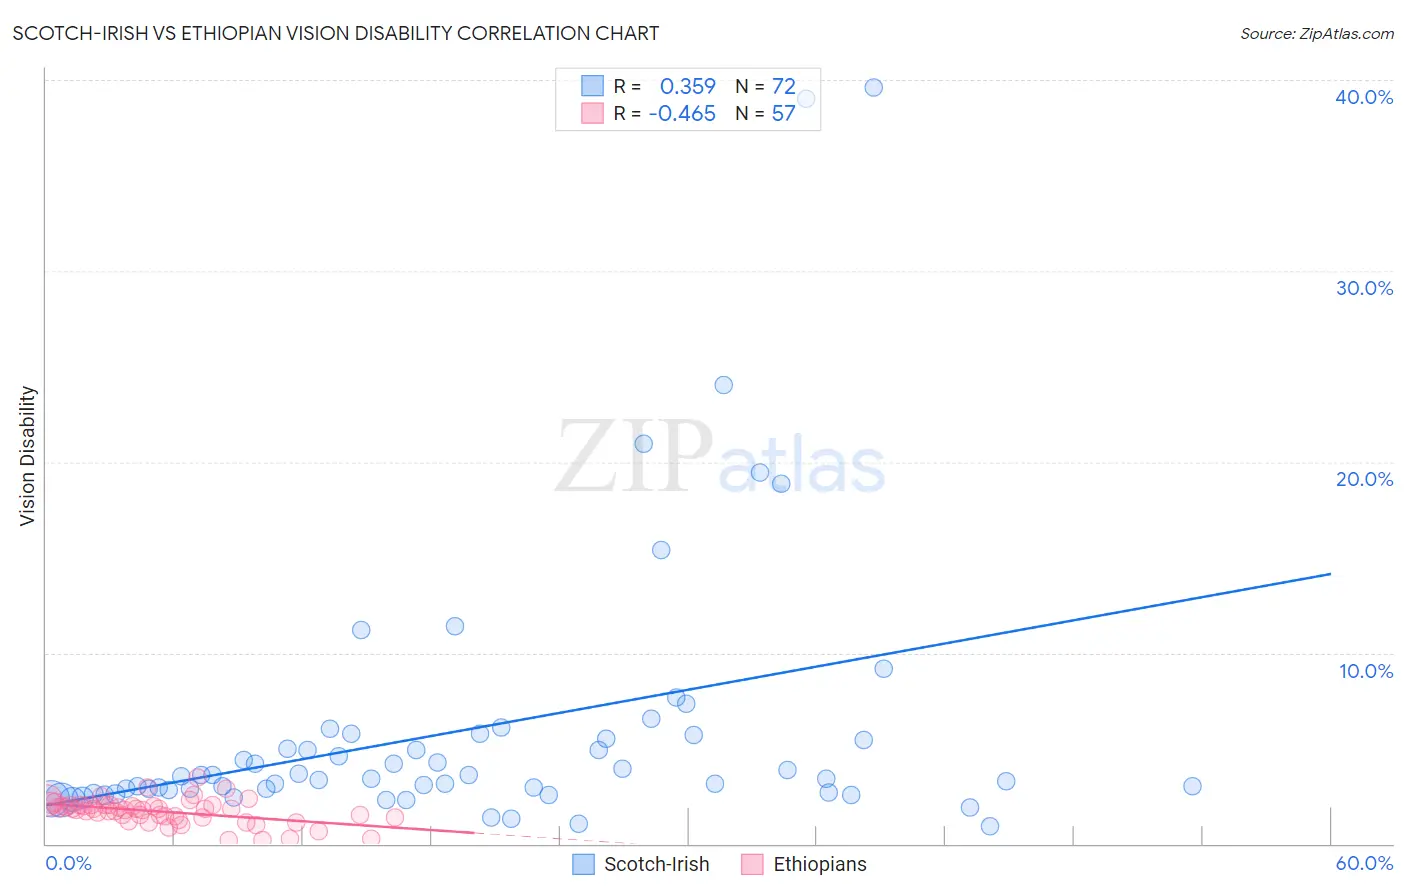
Scotch-Irish vs Ethiopian Vision Disability Correlation Chart
The statistical analysis conducted on geographies consisting of 547,366,805 people shows a mild positive correlation between the proportion of Scotch-Irish and percentage of population with vision disability in the United States with a correlation coefficient (R) of 0.359 and weighted average of 2.4%. Similarly, the statistical analysis conducted on geographies consisting of 223,170,588 people shows a moderate negative correlation between the proportion of Ethiopians and percentage of population with vision disability in the United States with a correlation coefficient (R) of -0.465 and weighted average of 2.0%, a difference of 23.7%.
Vision Disability Correlation Summary
| Measurement | Scotch-Irish | Ethiopian |
| Minimum | 0.89% | 0.17% |
| Maximum | 39.6% | 3.5% |
| Range | 38.7% | 3.3% |
| Mean | 6.0% | 1.7% |
| Median | 3.5% | 1.8% |
| Interquartile 25% (IQ1) | 2.7% | 1.4% |
| Interquartile 75% (IQ3) | 5.6% | 2.0% |
| Interquartile Range (IQR) | 2.9% | 0.62% |
| Standard Deviation (Sample) | 7.3% | 0.65% |
| Standard Deviation (Population) | 7.2% | 0.64% |
Similar Demographics by Vision Disability
Demographics Similar to Scotch-Irish by Vision Disability
In terms of vision disability, the demographic groups most similar to Scotch-Irish are Bahamian (2.4%, a difference of 0.040%), Chippewa (2.4%, a difference of 0.090%), Spanish (2.4%, a difference of 0.20%), Nepalese (2.4%, a difference of 0.21%), and Cape Verdean (2.4%, a difference of 0.25%).
| Demographics | Rating | Rank | Vision Disability |
| Celtics | 0.1 /100 | #269 | Tragic 2.4% |
| Cubans | 0.1 /100 | #270 | Tragic 2.4% |
| Immigrants | Azores | 0.1 /100 | #271 | Tragic 2.4% |
| Spaniards | 0.1 /100 | #272 | Tragic 2.4% |
| Immigrants | Bahamas | 0.1 /100 | #273 | Tragic 2.4% |
| Immigrants | Latin America | 0.0 /100 | #274 | Tragic 2.4% |
| Chippewa | 0.0 /100 | #275 | Tragic 2.4% |
| Scotch-Irish | 0.0 /100 | #276 | Tragic 2.4% |
| Bahamians | 0.0 /100 | #277 | Tragic 2.4% |
| Spanish | 0.0 /100 | #278 | Tragic 2.4% |
| Nepalese | 0.0 /100 | #279 | Tragic 2.4% |
| Cape Verdeans | 0.0 /100 | #280 | Tragic 2.4% |
| U.S. Virgin Islanders | 0.0 /100 | #281 | Tragic 2.5% |
| Immigrants | Caribbean | 0.0 /100 | #282 | Tragic 2.5% |
| Puget Sound Salish | 0.0 /100 | #283 | Tragic 2.5% |
Demographics Similar to Ethiopians by Vision Disability
In terms of vision disability, the demographic groups most similar to Ethiopians are Immigrants from Indonesia (2.0%, a difference of 0.030%), Immigrants from Sweden (2.0%, a difference of 0.040%), Eastern European (2.0%, a difference of 0.050%), Immigrants from Bulgaria (2.0%, a difference of 0.060%), and Immigrants from Ethiopia (2.0%, a difference of 0.11%).
| Demographics | Rating | Rank | Vision Disability |
| Immigrants | Kuwait | 99.8 /100 | #38 | Exceptional 2.0% |
| Zimbabweans | 99.7 /100 | #39 | Exceptional 2.0% |
| Immigrants | Ireland | 99.7 /100 | #40 | Exceptional 2.0% |
| Cypriots | 99.7 /100 | #41 | Exceptional 2.0% |
| Immigrants | Ethiopia | 99.7 /100 | #42 | Exceptional 2.0% |
| Eastern Europeans | 99.7 /100 | #43 | Exceptional 2.0% |
| Immigrants | Indonesia | 99.7 /100 | #44 | Exceptional 2.0% |
| Ethiopians | 99.7 /100 | #45 | Exceptional 2.0% |
| Immigrants | Sweden | 99.7 /100 | #46 | Exceptional 2.0% |
| Immigrants | Bulgaria | 99.7 /100 | #47 | Exceptional 2.0% |
| Israelis | 99.6 /100 | #48 | Exceptional 2.0% |
| Latvians | 99.5 /100 | #49 | Exceptional 2.0% |
| Afghans | 99.5 /100 | #50 | Exceptional 2.0% |
| Tongans | 99.5 /100 | #51 | Exceptional 2.0% |
| Immigrants | Serbia | 99.4 /100 | #52 | Exceptional 2.0% |