Scotch-Irish vs Immigrants from Latvia Vision Disability
COMPARE
Scotch-Irish
Immigrants from Latvia
Vision Disability
Vision Disability Comparison
Scotch-Irish
Immigrants from Latvia
2.4%
VISION DISABILITY
0.0/ 100
METRIC RATING
276th/ 347
METRIC RANK
2.0%
VISION DISABILITY
97.3/ 100
METRIC RATING
84th/ 347
METRIC RANK
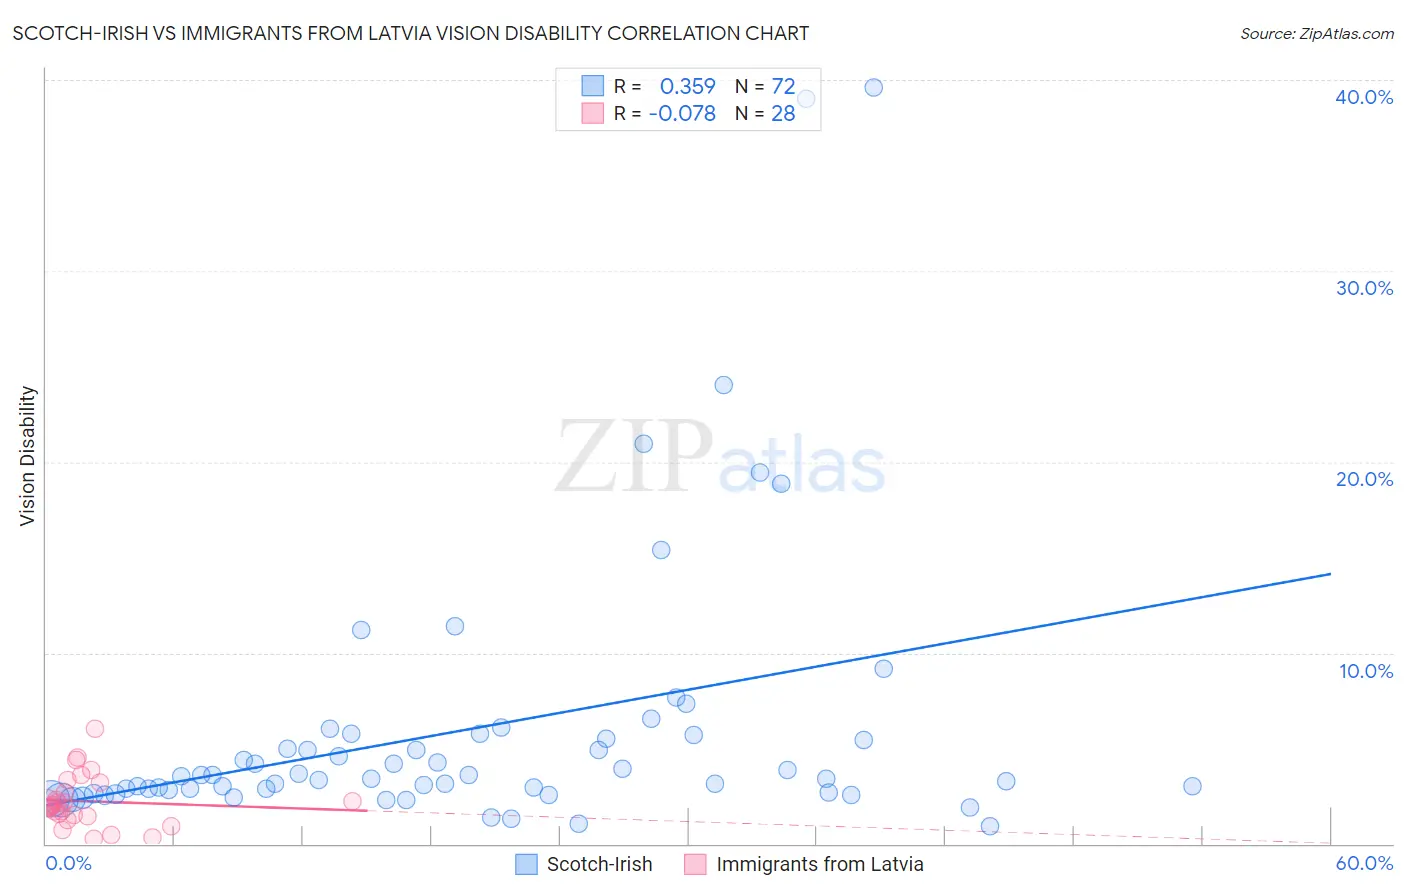
Scotch-Irish vs Immigrants from Latvia Vision Disability Correlation Chart
The statistical analysis conducted on geographies consisting of 547,366,805 people shows a mild positive correlation between the proportion of Scotch-Irish and percentage of population with vision disability in the United States with a correlation coefficient (R) of 0.359 and weighted average of 2.4%. Similarly, the statistical analysis conducted on geographies consisting of 113,721,440 people shows a slight negative correlation between the proportion of Immigrants from Latvia and percentage of population with vision disability in the United States with a correlation coefficient (R) of -0.078 and weighted average of 2.0%, a difference of 19.4%.
Vision Disability Correlation Summary
| Measurement | Scotch-Irish | Immigrants from Latvia |
| Minimum | 0.89% | 0.29% |
| Maximum | 39.6% | 6.0% |
| Range | 38.7% | 5.7% |
| Mean | 6.0% | 2.2% |
| Median | 3.5% | 2.0% |
| Interquartile 25% (IQ1) | 2.7% | 1.5% |
| Interquartile 75% (IQ3) | 5.6% | 3.0% |
| Interquartile Range (IQR) | 2.9% | 1.5% |
| Standard Deviation (Sample) | 7.3% | 1.4% |
| Standard Deviation (Population) | 7.2% | 1.3% |
Similar Demographics by Vision Disability
Demographics Similar to Scotch-Irish by Vision Disability
In terms of vision disability, the demographic groups most similar to Scotch-Irish are Bahamian (2.4%, a difference of 0.040%), Chippewa (2.4%, a difference of 0.090%), Spanish (2.4%, a difference of 0.20%), Nepalese (2.4%, a difference of 0.21%), and Cape Verdean (2.4%, a difference of 0.25%).
| Demographics | Rating | Rank | Vision Disability |
| Celtics | 0.1 /100 | #269 | Tragic 2.4% |
| Cubans | 0.1 /100 | #270 | Tragic 2.4% |
| Immigrants | Azores | 0.1 /100 | #271 | Tragic 2.4% |
| Spaniards | 0.1 /100 | #272 | Tragic 2.4% |
| Immigrants | Bahamas | 0.1 /100 | #273 | Tragic 2.4% |
| Immigrants | Latin America | 0.0 /100 | #274 | Tragic 2.4% |
| Chippewa | 0.0 /100 | #275 | Tragic 2.4% |
| Scotch-Irish | 0.0 /100 | #276 | Tragic 2.4% |
| Bahamians | 0.0 /100 | #277 | Tragic 2.4% |
| Spanish | 0.0 /100 | #278 | Tragic 2.4% |
| Nepalese | 0.0 /100 | #279 | Tragic 2.4% |
| Cape Verdeans | 0.0 /100 | #280 | Tragic 2.4% |
| U.S. Virgin Islanders | 0.0 /100 | #281 | Tragic 2.5% |
| Immigrants | Caribbean | 0.0 /100 | #282 | Tragic 2.5% |
| Puget Sound Salish | 0.0 /100 | #283 | Tragic 2.5% |
Demographics Similar to Immigrants from Latvia by Vision Disability
In terms of vision disability, the demographic groups most similar to Immigrants from Latvia are Chinese (2.0%, a difference of 0.060%), Immigrants from Moldova (2.0%, a difference of 0.080%), Immigrants from Western Asia (2.0%, a difference of 0.12%), Immigrants from Switzerland (2.0%, a difference of 0.14%), and Norwegian (2.0%, a difference of 0.15%).
| Demographics | Rating | Rank | Vision Disability |
| Immigrants | Jordan | 98.3 /100 | #77 | Exceptional 2.0% |
| Immigrants | Eastern Europe | 98.3 /100 | #78 | Exceptional 2.0% |
| Assyrians/Chaldeans/Syriacs | 98.1 /100 | #79 | Exceptional 2.0% |
| Lithuanians | 97.7 /100 | #80 | Exceptional 2.0% |
| Soviet Union | 97.6 /100 | #81 | Exceptional 2.0% |
| Immigrants | Poland | 97.6 /100 | #82 | Exceptional 2.0% |
| Immigrants | Western Asia | 97.5 /100 | #83 | Exceptional 2.0% |
| Immigrants | Latvia | 97.3 /100 | #84 | Exceptional 2.0% |
| Chinese | 97.2 /100 | #85 | Exceptional 2.0% |
| Immigrants | Moldova | 97.2 /100 | #86 | Exceptional 2.0% |
| Immigrants | Switzerland | 97.0 /100 | #87 | Exceptional 2.0% |
| Norwegians | 97.0 /100 | #88 | Exceptional 2.0% |
| Immigrants | Eastern Africa | 97.0 /100 | #89 | Exceptional 2.0% |
| Immigrants | Lebanon | 96.7 /100 | #90 | Exceptional 2.1% |
| Immigrants | Somalia | 96.2 /100 | #91 | Exceptional 2.1% |