Zimbabwean vs Immigrants from Latvia Ambulatory Disability
COMPARE
Zimbabwean
Immigrants from Latvia
Ambulatory Disability
Ambulatory Disability Comparison
Zimbabweans
Immigrants from Latvia
5.4%
AMBULATORY DISABILITY
100.0/ 100
METRIC RATING
25th/ 347
METRIC RANK
6.0%
AMBULATORY DISABILITY
71.1/ 100
METRIC RATING
159th/ 347
METRIC RANK
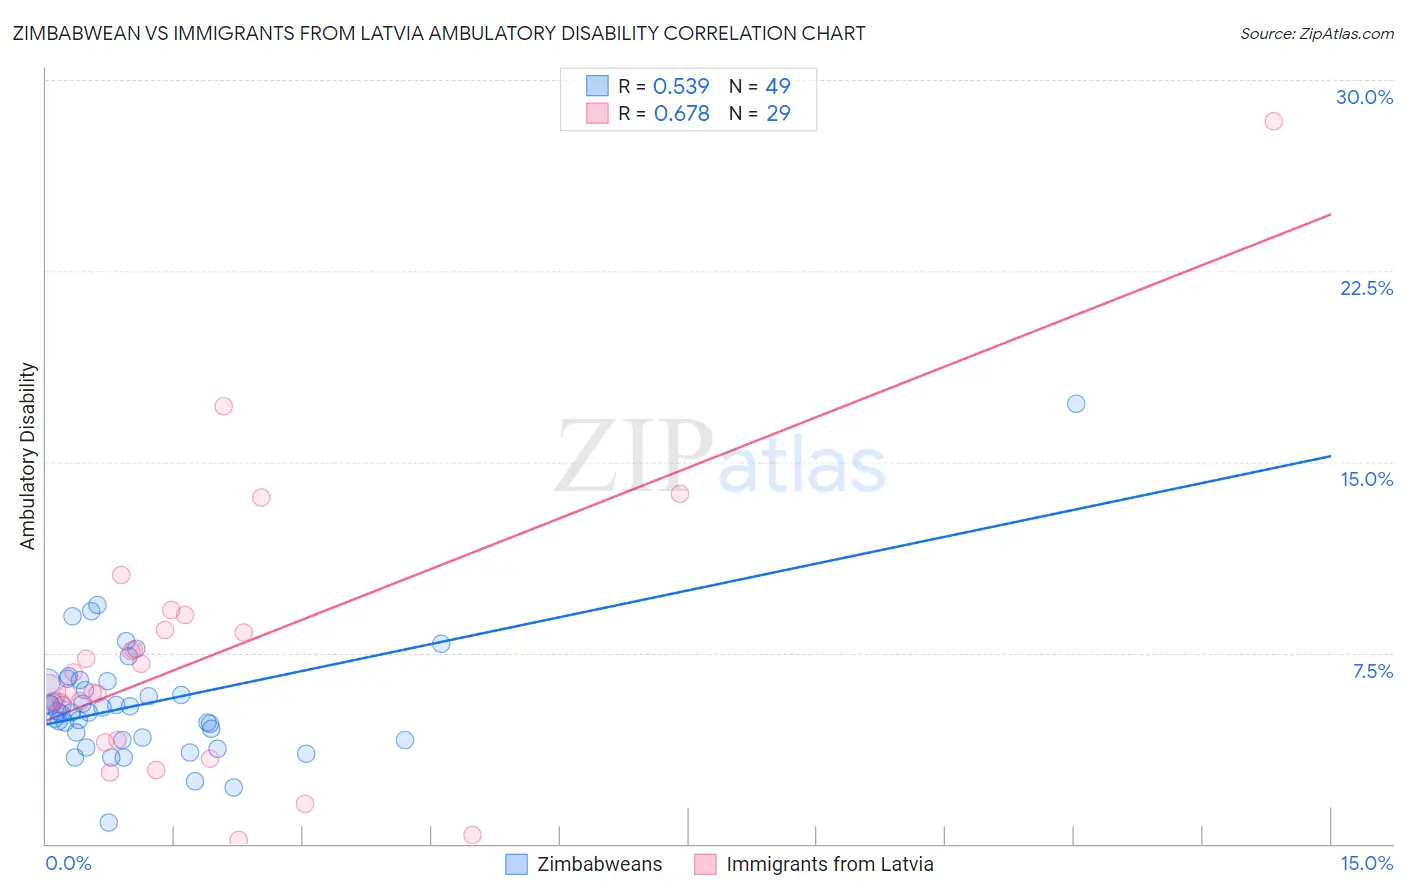
Zimbabwean vs Immigrants from Latvia Ambulatory Disability Correlation Chart
The statistical analysis conducted on geographies consisting of 69,187,176 people shows a substantial positive correlation between the proportion of Zimbabweans and percentage of population with ambulatory disability in the United States with a correlation coefficient (R) of 0.539 and weighted average of 5.4%. Similarly, the statistical analysis conducted on geographies consisting of 113,736,193 people shows a significant positive correlation between the proportion of Immigrants from Latvia and percentage of population with ambulatory disability in the United States with a correlation coefficient (R) of 0.678 and weighted average of 6.0%, a difference of 12.1%.
Ambulatory Disability Correlation Summary
| Measurement | Zimbabwean | Immigrants from Latvia |
| Minimum | 0.83% | 0.16% |
| Maximum | 17.3% | 28.4% |
| Range | 16.5% | 28.2% |
| Mean | 5.5% | 7.4% |
| Median | 5.2% | 6.0% |
| Interquartile 25% (IQ1) | 4.1% | 4.0% |
| Interquartile 75% (IQ3) | 6.4% | 8.7% |
| Interquartile Range (IQR) | 2.2% | 4.7% |
| Standard Deviation (Sample) | 2.4% | 5.6% |
| Standard Deviation (Population) | 2.4% | 5.5% |
Similar Demographics by Ambulatory Disability
Demographics Similar to Zimbabweans by Ambulatory Disability
In terms of ambulatory disability, the demographic groups most similar to Zimbabweans are Immigrants from Nepal (5.4%, a difference of 0.030%), Immigrants from Saudi Arabia (5.4%, a difference of 0.080%), Tongan (5.4%, a difference of 0.17%), Asian (5.4%, a difference of 0.19%), and Immigrants from Israel (5.4%, a difference of 0.21%).
| Demographics | Rating | Rank | Ambulatory Disability |
| Immigrants | Sri Lanka | 100.0 /100 | #18 | Exceptional 5.4% |
| Indians (Asian) | 100.0 /100 | #19 | Exceptional 5.4% |
| Ethiopians | 100.0 /100 | #20 | Exceptional 5.4% |
| Immigrants | Kuwait | 100.0 /100 | #21 | Exceptional 5.4% |
| Immigrants | Israel | 100.0 /100 | #22 | Exceptional 5.4% |
| Tongans | 100.0 /100 | #23 | Exceptional 5.4% |
| Immigrants | Saudi Arabia | 100.0 /100 | #24 | Exceptional 5.4% |
| Zimbabweans | 100.0 /100 | #25 | Exceptional 5.4% |
| Immigrants | Nepal | 100.0 /100 | #26 | Exceptional 5.4% |
| Asians | 100.0 /100 | #27 | Exceptional 5.4% |
| Cambodians | 100.0 /100 | #28 | Exceptional 5.4% |
| Immigrants | Iran | 100.0 /100 | #29 | Exceptional 5.4% |
| Immigrants | Turkey | 100.0 /100 | #30 | Exceptional 5.4% |
| Immigrants | Venezuela | 100.0 /100 | #31 | Exceptional 5.4% |
| Immigrants | Australia | 100.0 /100 | #32 | Exceptional 5.5% |
Demographics Similar to Immigrants from Latvia by Ambulatory Disability
In terms of ambulatory disability, the demographic groups most similar to Immigrants from Latvia are Immigrants from Fiji (6.0%, a difference of 0.010%), Ghanaian (6.0%, a difference of 0.020%), Northern European (6.0%, a difference of 0.050%), Immigrants from Scotland (6.0%, a difference of 0.070%), and Central American (6.0%, a difference of 0.080%).
| Demographics | Rating | Rank | Ambulatory Disability |
| Immigrants | Austria | 78.8 /100 | #152 | Good 6.0% |
| Syrians | 75.5 /100 | #153 | Good 6.0% |
| Immigrants | Croatia | 75.1 /100 | #154 | Good 6.0% |
| Immigrants | Scotland | 72.1 /100 | #155 | Good 6.0% |
| Northern Europeans | 71.8 /100 | #156 | Good 6.0% |
| Ghanaians | 71.3 /100 | #157 | Good 6.0% |
| Immigrants | Fiji | 71.2 /100 | #158 | Good 6.0% |
| Immigrants | Latvia | 71.1 /100 | #159 | Good 6.0% |
| Central Americans | 69.8 /100 | #160 | Good 6.0% |
| Immigrants | Belarus | 69.2 /100 | #161 | Good 6.1% |
| Nigerians | 67.1 /100 | #162 | Good 6.1% |
| Lebanese | 66.2 /100 | #163 | Good 6.1% |
| Basques | 63.7 /100 | #164 | Good 6.1% |
| Nicaraguans | 63.2 /100 | #165 | Good 6.1% |
| Iraqis | 62.8 /100 | #166 | Good 6.1% |